Configure and Deploy Application Metadata Exporter (AMX)
In GigaVUE-FM, you must do the following to configure the Application Metadata Exporter application in a Monitoring Session. Refer to Application Metadata Exporter for more details.
To deploy Application Metadata Exporter application in the respective cloud platform, refer to Deploy Fabric Components using Generic Mode.
|
S.No |
Steps |
Refer to |
|
1 |
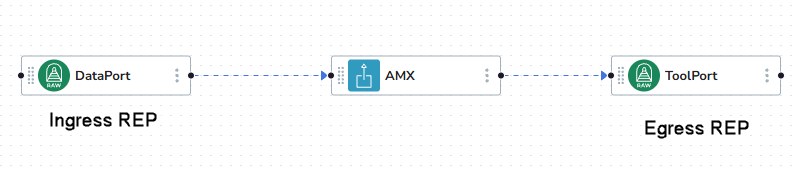
Create an ingress REP |
Create Raw Endpoint (VMware vCenter) |
|
2 |
Add AMX Application |
|
|
3 |
Create a link between the ingress REP and Application Metadata Exporter application |
N/A |
|
4 |
Create an egress REP |
Create Raw Endpoint (VMware vCenter) |
|
5 |
Create a link between the Application Metadata Exporter application and egress REP |
N/A |
- Go to Traffic > Virtual > Orchestrated Flows and select your cloud platform. The Monitoring Session page appears.Notes:
Ensure to create separate Monitoring Domains and Monitoring Sessions for Application Metadata Exporter (AMX) and Application Metadata Intelligence (AMI). Even when AMI is deployed virtually, it operates independently and requires its own Monitoring Session.
You can use the Third-Party Orchestration method when deploying fabric components—such as the AMX V Series Node—on your own.
- When deploying AMX using the Third-Party Orchestration method, Monitoring Session must also be configured in the same work flow. To deploy through Third Party Orchestration, go to Traffic > Virtual > Orchestrated Flows > Third Party Orchestration.
Before deploying AMX, ensure to change the Traffic Acquisition Method to Customer Orchestrated Source in the Monitoring Domain. Refer to Create Monitoring Domain.
- After creating a new Monitoring Session or on an existing Monitoring Session, navigate to the TRAFFIC PROCESSING tab. The GigaVUE-FM Monitoring Session canvas page appears.
- In the canvas, click the
 icon on the left side of the page to view the traffic processing elements. Drag and drop AMX from APPLICATIONS to the graphical workspace. The application quick view appears.
 - Enter the Alias for the application.
- In the Ingestor section, enter or select the following details. Click
 to add another ingestor to add multiple inputs to the AMX application and click
  to remove an existing ingestor.
Fields
Description
Name
Enter name for the Ingestor.
Port
Enter the port number to which the Application Metadata must be ingested.
Type
Select AMI as the input type.
- Enter or select the following details in Cloud Tools Export section:
Fields
Description
Alias
Enter the alias name for the cloud tool export.
Cloud Tool
Select Other from the drop-down menu.
Endpoint
Enter the IP address of the Virtual Machine in which Gigamon Glimpse is installed and the ports are configured (http://<<ip-address>>:9559/).
Refer to Install Gigamon Glimpse using OVA file on VMware vCenter.
Headers
Enter the default secret key value: Authorization: Gigamon123! or enter the Secret Header and its corresponding Secret Value that you set up in Gigamon Glimpse instance. Refer to (Optional) Configure Authorization Secret Key for Gigamon Glimpse.
Add Content-Type: application/json in a separate header field. Ensure that the Secure Keys option is enabled.
Type AMI - Select this option to export AMI.
Interval
The time interval (in seconds) in which the data should be uploaded periodically. The default value is 30 seconds.
Request Timeout
This is the time exporter waits for a response back from the tool. The default value is 30 seconds.
- Click Save.
To deploy the configured Application Metadata Exporter application, follow the steps below:
| 1. | On the Monitoring Session canvas page, click Deploy from the Actions menu to deploy the Monitoring Session. The status is displayed as Success on the Monitoring Sessions page. The session is successfully deployed on the V Series Node. |
| 2. | You can view the Monitoring Session Deployment Report in the V SERIES NODES tab. When you click on the Status link, the Deployment Report is displayed. If the Monitoring Session is not deployed correctly, then one of the following errors is displayed in the Status column. |
| Success—The session is not deployed on one or more instances due to V Series Node failure. |
| Failure—The session is not deployed on any of the V Series Nodes or Instances. |


