Create Raw Endpoint (VMware vCenter)
This topic provides instructions on configuring a RAW Endpoint (REP) in the Monitoring Session.
Rules and Notes
-
Ingress REP works only when you select the Traffic Acquisition Method as Customer Orchestrated Source while configuring the Monitoring Domain.
For details, refer to Create Monitoring Domain for VMware ESXi -
The maximum number of links that can egress from any endpoint in V Series is four.
Consideration
When deploying GigaVUE V Series Nodes in the Monitoring Domain, the number of interfaces varies based on the Traffic Acquisition Method. See the table below for details.
| Traffic Acquisition Method | Display Name | Interface Name | Role | Comments |
|---|---|---|---|---|
|
Customer Orchestrated Source |
Network Adapter 1 |
ens160 |
Management |
|
|
Network Adapter 2 |
ens192 |
Data |
Supports Tunnel and RAW endpoint. Available for Ingress and Egress REP |
|
|
Network Adapter 3 |
ens224 |
Data |
Supports Tunnel and RAW endpoint. Available for Ingress and Egress REP |
|
| Platform Tapping
|
Network Adapter 1 |
ens160 |
Management |
|
|
Network Adapter 2 |
ens192 |
Data |
Supports Tunnel and Egress RAW endpoint. |
|
|
Network Adapter 3 - 10 |
- |
Data |
Reserved and used for platform tapping (Port Mirroring) |
Configure Raw Endpoint in Monitoring Session
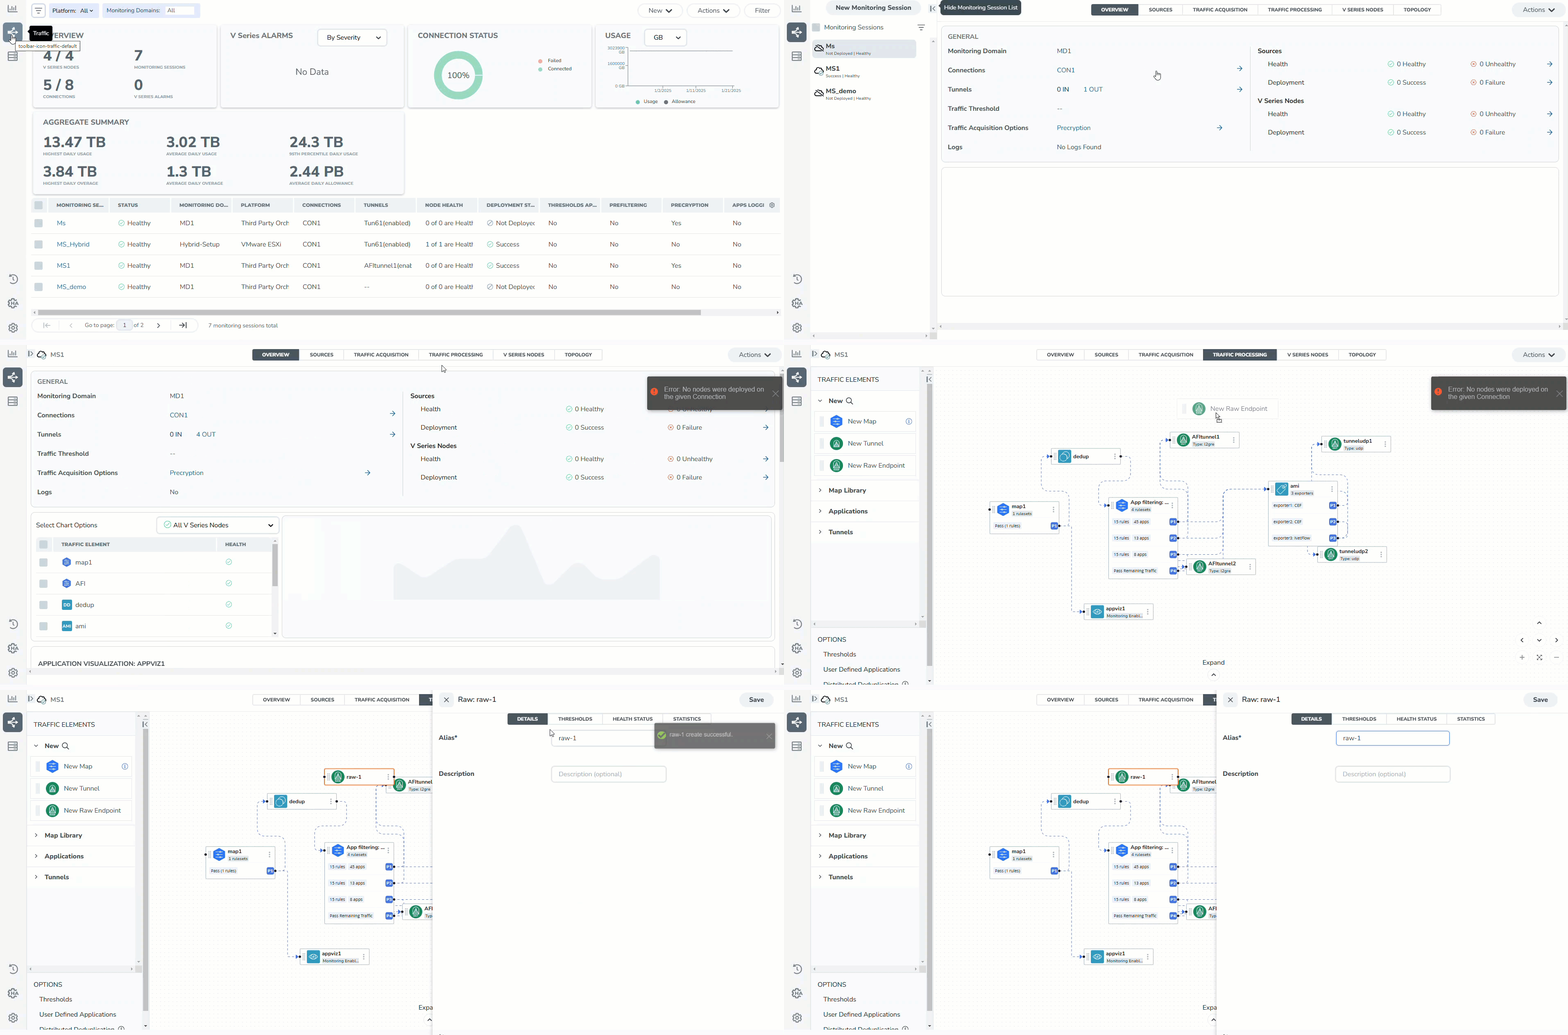
Raw End Point (REP) is used to pass traffic from an interface. REP is used to ingress data from a physical interface attached to GigaVUE V Series Nodes. You can optionally use this end point to send traffic to the applications deployed in the monitoring session.
To configure,
- From the New expand menu, drag and drop New Raw Endpoint to the graphical workspace.
- On the new raw endpoint icon, select the
 menu button and select Details.
The Raw quick view page appears. - Enter the Alias and Description details for the Raw End Point and select Save.

- Perform the following steps to deploy the Monitoring Session after adding the Raw Endpoint:
From the Actions drop-down list on the TRAFFIC PROCESSING page, select Deploy. The Deploy Monitoring Session dialog box appears.
Select the V Series Nodes to deploy the Monitoring Session.
From the drop-down menu of the selected individual V Series Nodes, select the interfaces for each REPs and the TEPs deployed in the Monitoring Session.
Select Deploy.
- Select Export to download all or selected V Series Nodes in the CSV and XLSX formats.


