Work with the Analytics User Interface
GigaVUE‑FM allows you to share the dashboard, clone the dashboard, generate the report, copy the dashboard, search data, etc., To know more about the user interface, refer to following sections:
Share
Use to share Dashboard pages with other users. To share a dashboard:
- Navigate to the Dashboard page that you want to share.
- From the top navigation bar, click Share.
-
The following options are available:
- Embed Code: Use to share the dashboard in an iFrame Embed URL.
- Permalinks: Use to share the permalink URL of the dashboard page.
Clone
Use to clone the system dashboard pages. Refer to the Clone Dashboard section for the details.
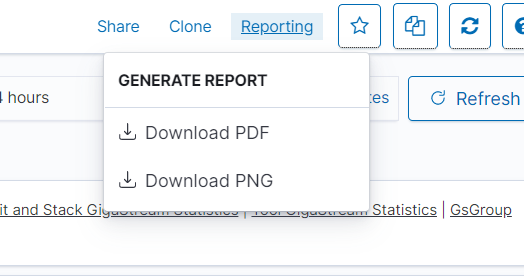
Reporting
Use to generate the report in PDF or in PNG format that can be downloaded instantly. The generated report is also listed in the Reports page. Refer to the Reports section for details.
Set as Default 
Use to change the default dashboard page:
- Navigate to the specific dashboard page.
-
Click to set this dashboard page as default.
(missing or bad snippet)(missing or bad snippet)
Filter Data Using Tags in Control Filters
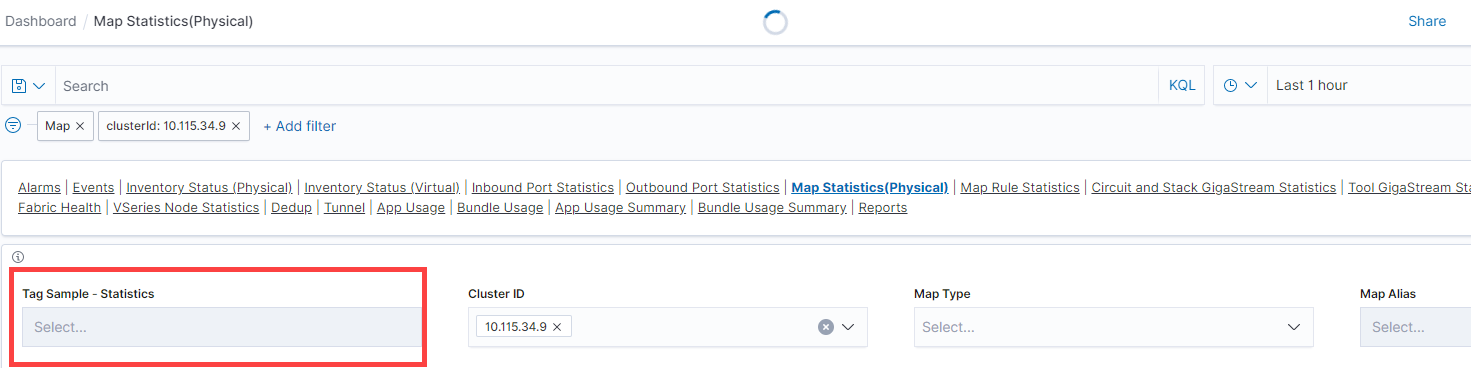
Customize the Tag Sample - Statistics option available in some of the Statistical Dashboards to filter the data based on the required tags.
Pre-requisites
- Ensure to add the required tag keys and tag values to the tags page, and associate the tag values to the resources.
-
Use the
 Refresh Index Pattern icon for the newly added tags to get reflected in the Analytics page.
Consider a scenario in which you want to filter the inventory details in GigaVUE-FM based on a newly created tag key called SITE:
To do this:
- Clone the required statistical dashboard.
- Click Edit.
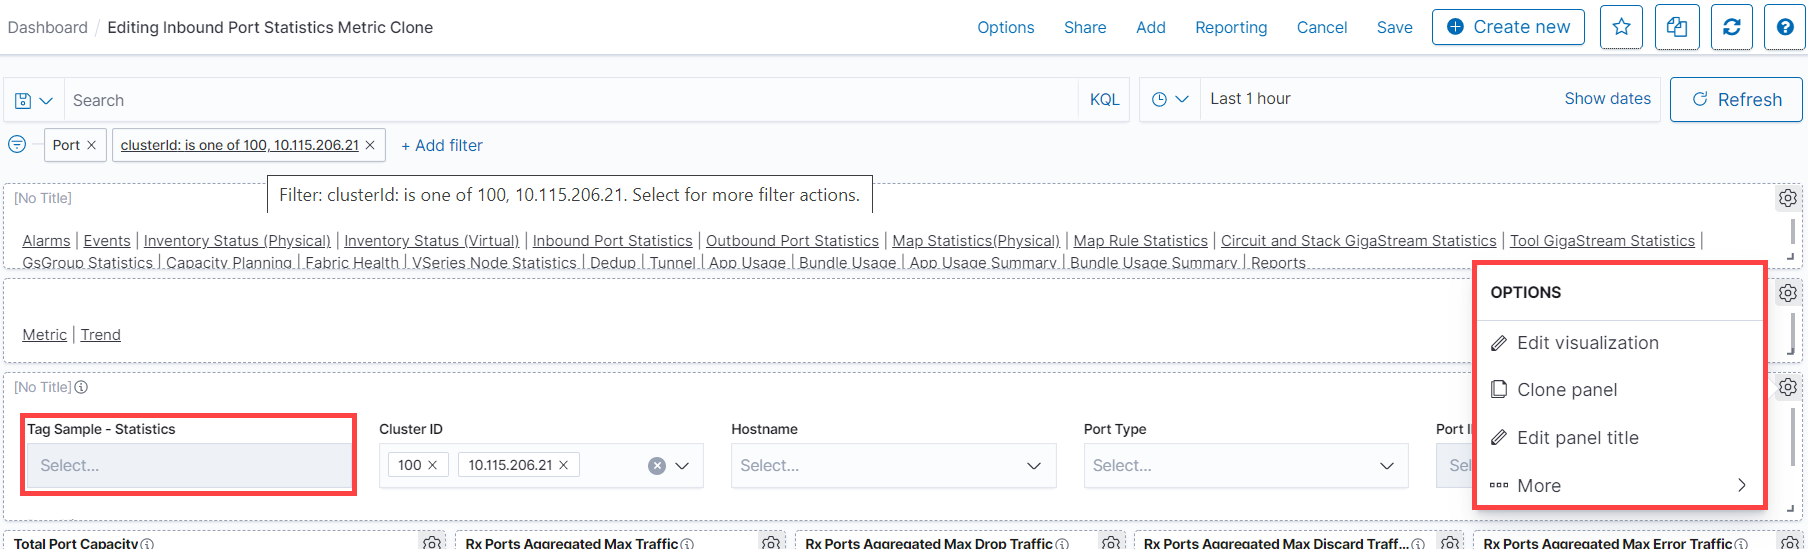
- Scroll to the Control Visualization panel. Click Options and select Edit Visualization.
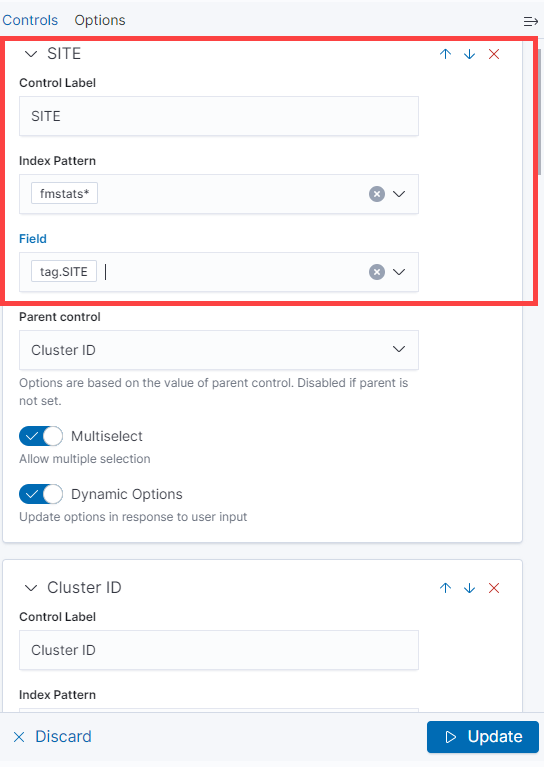
- In the Control tab, configure the following. This is for filtering the data based on the tag value SITE.
- Configure the existing tags as required:
- In the Option tab, configure the following:
- Click Update to update the changes.
- Customize the panel title or remove it, as required. Move the control visualization to the top.
| Control Label | Site |
| Index Pattern | fmstats* |
| Field | tag.site |
| Parent Control | Use to configure a specific field as a parent based on which the other fields are filtered |
| Multiselect | Use to select multiple variables within a field |
| Dynamic Options | Use to update the dashboards and visualizations dynamically based on this criteria. |
| Update Kibana filters on each change | |
| Use time filter | To update the data based on the time filter configured in the dashboard. |
| Pin filters for all applications |
You can also create a new control visualization using the steps described above.
Search Data
To search your data:
- Enter the search criteria in the Query bar.
- Press Enter or click Update/Refresh button to submit the request.
- Click the Saved Queries icon to save the current query.
You can use Kibana’s standard query language (KQL).
Note: When you submit a search request, the histogram, Documents table, Fields list and all the widgets in the dashboard are updated to reflect the search results.
(missing or bad snippet)


