Gigamon ThreatINSIGHT Sensor
Gigamon ThreatINSIGHT is a SaaS-based network security monitoring platform built with the ability to detect, respond, and investigate network-based threats. ThreatINSIGHT has the following key features:
| Rapid threat-hunting support with rich metadata search of supported protocols |
| Powerful visualization tools for tracking the different aspects of your network |
| Automated threat-detections built with alerting functionality |
The GigamonThreatINSIGHT Sensor—deployed on the GigaVUE-HC1 SMT-HC1-S module using GigaVUE‑FM—provides a single, integrated security solution for threat-detection.
Note: For more information about Gigamon ThreatINSIGHT, refer to the ThreatINSIGHT Portal Guides. To access the Portal Guides, log in to Gigamon ThreatINSIGHT, and then go to Help > Portal Guides.
Keep in mind the following rules and notes before you deploy Gigamon ThreatINSIGHT on the SMT-HC1-S module:
| You can attach only one ThreatINSIGHT Sensor to a GigaSMART engine. |
| You cannot enable other GigaSMART operations on the GigaSMART engine to which the ThreatINSIGHT Sensor is attached. |
| You cannot delete a virtual port that is attached to the GigaSMART engine on which the ThreatINSIGHT Sensor is provisioned. |
| If you delete the ThreatINSIGHT Sensor tool from GigaVUE-FM, the ThreatINSIGHT Sensor statistics are cleared from GigaVUE-FM and the GigaVUE-HC1 device. You must re-provision the ThreatINSIGHT Sensor tool in GigaVUE-FM using a new provision code from the Gigamon ThreatINSIGHT Portal. |
Perform the following tasks to deploy the ThreatINSIGHT Sensor and monitor the traffic flow:
|
Step |
Task |
Refer to |
|||||||||||||||
|---|---|---|---|---|---|---|---|---|---|---|---|---|---|---|---|---|---|
|
1. |
Deploy Gigamon ThreatINSIGHT Sensor as a tool on the SMT-HC1-S module of GigaVUE‑HC1. |
||||||||||||||||
|
2. |
Configure either a classic map or a Fabric map to filter and forward the traffic. Before you proceed with map configurations, ensure that the status of the ThreatINSIGHT Sensor is Online and that the Sensor alias is correctly populated. Keep in mind the following details when you configure a classic map or a Fabric map:
Note: The virtual port will be available for selection only if you select the map type as First Level. The ThreatINSIGHT Sensor starts to analyze the traffic and polls the data to the Gigamon ThreatINSIGHT Portal. |
|
|||||||||||||||
|
3. |
View the network events that the ThreatINSIGHT Sensor generates when it inspects the traffic and extracts key protocol metadata for processing. You can run a query to view the events generated in the Last 1 Hour, Last 24 Hours, Last 7 Days, or Last 30 Days. |
||||||||||||||||
|
4. |
View the statistics of the data received and analyzed by the ThreatINSIGHT Sensor in GigaVUE-FM. |
To integrate Gigamon ThreatINSIGHT with SMT-HC1-S module, you must deploy the ThreatINSIGHT Sensor as one of the tools on the SMT-HC1-S module. This topic provides instructions to complete the deployment.
Ensure that you complete the following prerequisites before you start with Gigamon ThreatINSIGHT Sensor deployment:
| Upgrade your GigaVUE‑FM instance. Refer to SMT-HC1-S (Gen 3 GigaSMART Card) for supported versions and upgrade paths. |
Note: The latest Long Term Support (LTS) version is usually recommended. For the latest LTS release information, refer to the Gigamon Software Release Status article on the Community.
| Add the GigaVUE-HC1 device that has the SMT-HC1-S module installed. For instructions, refer to Add New Physical Node or Cluster to GigaVUE-FM. |
| Generate a provision code from the Gigamon ThreatINSIGHT Portal to validate your Gigamon ThreatINSIGHT integration. The provision code that you generate is valid for 24 hours. For instructions, refer to the "Generate a Registration Code" section in the ThreatINSIGHT Portal Guides. |
Note: To access the Portal Guides, log in to the ThreatINSIGHT Portal and go to Help > Portal Guides.
| Ensure that the GigaSMART engine port on which you want to deploy the ThreatINSIGHT Sensor has internet connectivity so that the ThreatINSIGHT Sensor can connect to AWS. |
Note: If you are installing the SMT-HC1-S (Gen 3 GigaSMART Card), use the recommended upgrade path specific to this module. Refer to SMT-HC1-S (Gen 3 GigaSMART Card), for details.
To configure the network access:
| a. | From the device view, go to Ports > Ports > All Ports. |
| b. | Select the engine port and then click Edit. |
| c. | You can either manually assign the IP address or select the Enable DHCP check box to dynamically assign the IP address and other network configuration parameters. |
| d. | Select eth2 as the interface, and then click OK. |
Before you proceed with the deployment, ensure that you complete all prerequisites listed in the Prerequisites section.
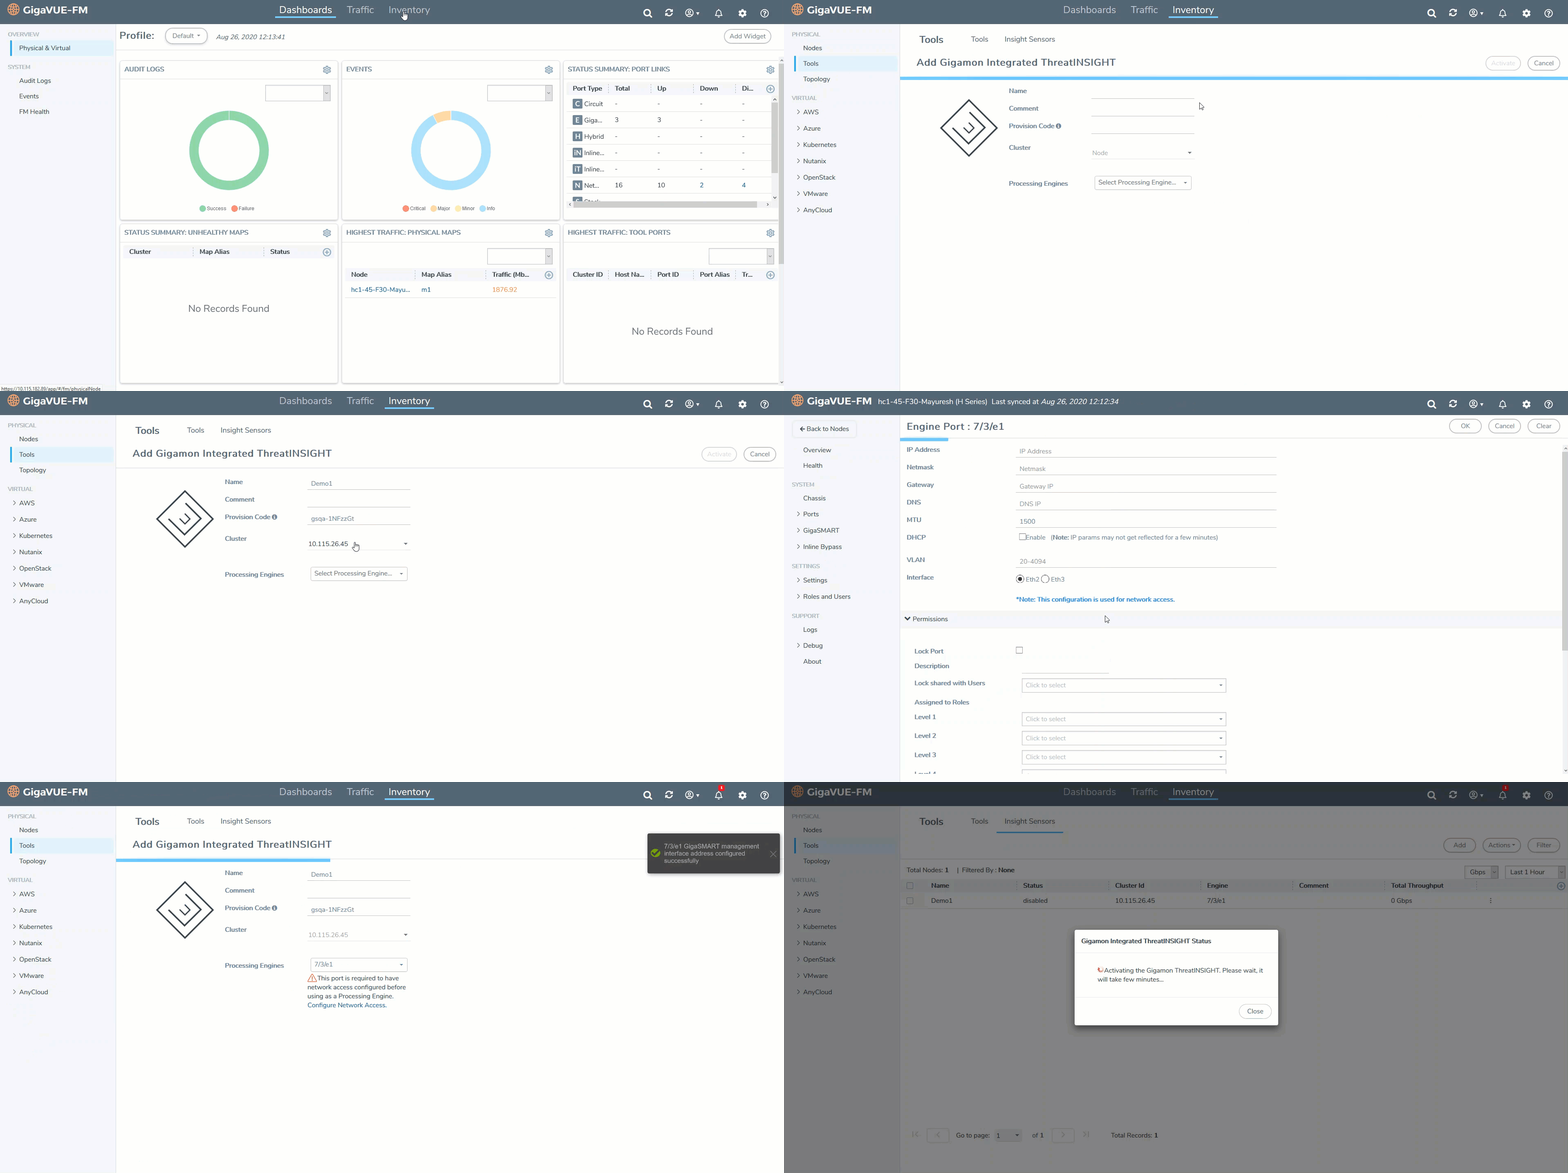
To deploy Gigamon ThreatINSIGHT Sensor on the SMT-HC1-S module of GigaVUE-HC1:
| 1. | Log in to GigaVUE-FM, and then go to Inventory > Tools > Insight Sensors. |
| 2. | Click Add, and then in the Add Gigamon Integrated ThreatINSIGHT page, enter a unique name for the ThreatINSIGHT Sensor that you are deploying. |
| 3. | In the Provision Code field, enter the provision code that you have generated from the Gigamon ThreatINSIGHT Portal. |
| 4. | In the Cluster field, select the GigaVUE-HC1 node that has the SMT-HC1-S module installed. |
| 5. | In the Processing Engines field, select the required GigaSMART engine port to which you want to deploy the ThreatINSIGHT Sensor. |
Note: Only GigaSMART engine ports that are capable of ThreatINSIGHT Sensor deployment are listed.
| 6. | Click Activate. |

GigaVUE-FM creates the required configurations, such as the GigaSMART group and the Virtual port on the SMT-HC1-S module. GigaVUE-FM, then establishes connection with the ThreatINSIGHT Sensor using the provision code you provided. The ThreatINSIGHT Sensor communicates with the Gigamon ThreatINSIGHT Portal and obtains a sensor alias, which is populated in GigaVUE-FM and Gigamon ThreatINSIGHT Portal. It may take couple of minutes for the ThreatINSIGHT Sensor to be provisioned.
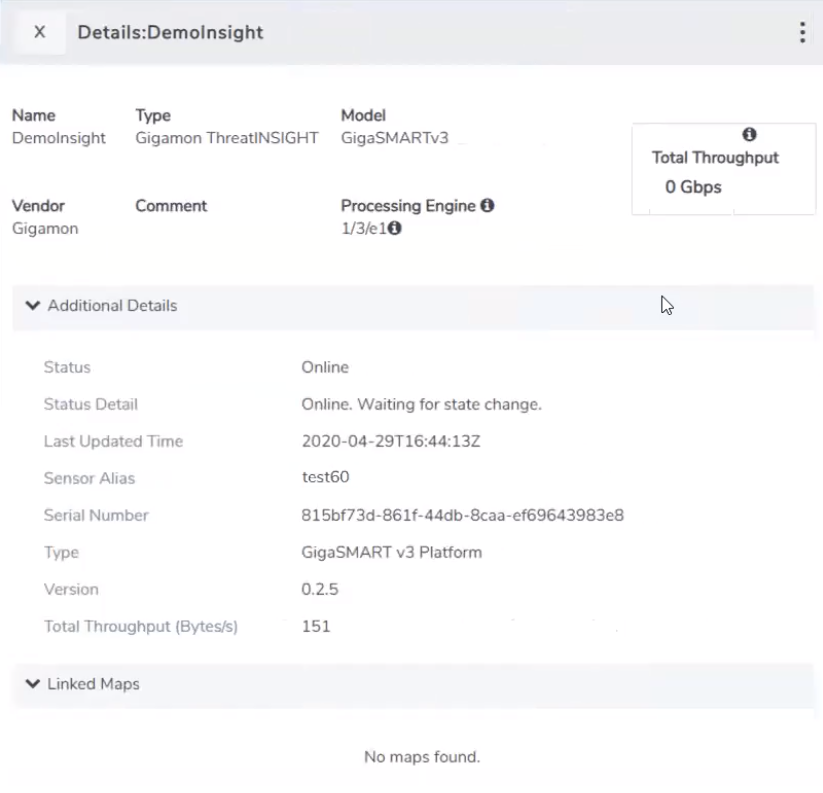
Ensure that the status of the ThreatINSIGHT Sensor is Online. You can view the status and alias of the ThreatINSIGHT Sensor in the following pages:
| GigaVUE‑FM—In the Tools page, select the ThreatINSIGHT Sensor that you have deployed, click the vertical ellipsis, and then select View Details. |

| Gigamon ThreatINSIGHT Customer Portal—Click the |

Once the Gigamon ThreatINSIGHT Sensor is deployed, you can view network events on the Gigamon ThreatINSIGHT portal. You can also view statistics from GigaVUE‑FM. This topic provides information about these activities as well as instructions for disabling or deleting the Gigamon ThreatINSIGHT Sensor.
You can choose to disable the ThreatINSIGHT Sensor in GigaVUE‑FM. Before you disable the ThreatINSIGHT Sensor, ensure that the sensor is not used in any maps. To disable the ThreatINSIGHT Sensor, go to the Tools page, select the ThreatINSIGHT Sensor, and then click Actions > Disable. It may take few minutes for the ThreatINSIGHT Sensor to be disabled.
To enable the ThreatINSIGHT Sensor, go to the Tools page, select the ThreatINSIGHT Sensor, and then click Actions > Enable. You do not need a new provision code to enable the ThreatINSIGHT Sensor. The status of the ThreatINSIGHT Sensor changes to Online. Refer to Verify Gigamon ThreatINSIGHT Sensor Status.
If you delete a ThreatINSIGHT Sensor tool from GigaVUE‑FM, the ThreatINSIGHT Sensor statistics are cleared from GigaVUE-FM and the GigaVUE-HC1 device. You must re-provision the ThreatINSIGHT Sensor tool in GigaVUE‑FM using a new provision code generated from the Gigamon ThreatINSIGHT Portal.
Before you delete a ThreatINSIGHT Sensor, ensure that the sensor is not used in any maps and that you have disabled the sensor.
To delete the ThreatINSIGHT Sensor, go to the Tools page, select the ThreatINSIGHT Sensor, and then click Actions > Delete.
Note: If you want to add the ThreatINSIGHT Sensor tool back in GigaVUE‑FM, it is recommended that you provide the same name so that you can obtain the old statistics from the ThreatINSIGHT Sensor tool.
The ThreatINSIGHT Sensor performs deep packet inspection of all observed network traffic and extracts out key protocol metadata for processing by the Gigamon ThreatINSIGHT data pipeline. This metadata is organized into records called events. For more information about events, refer to the "Network Events" section in the ThreatINSIGHT Portal Guides.
To view the network events in Gigamon ThreatINSIGHT Portal, go to Investigate > Events. You can run a query to view the events generated in the Last 1 Hour, Last 24 Hours, Last 7 Days, or Last 30 Days. For example, to view all the events generated for a specific ThreatINSIGHT Sensor alias, run the following query:
sensor_id = "test60"

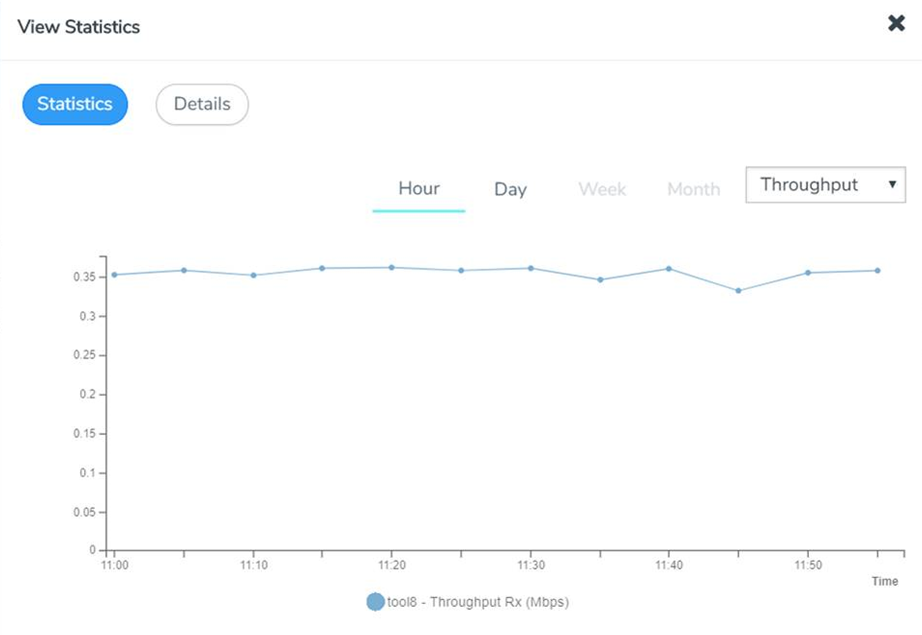
GigaVUE‑FM polls the ThreatINSIGHT Sensor to obtain statistics for the following types of counters:
| Total Data—The total data received and analyzed by the ThreatINSIGHT Sensor. |
| Total Packets—The number of packets received and analyzed by the ThreatINSIGHT Sensor. |
| Throughput—The amount of data successfully processed by the ThreatINSIGHT Sensor. This is the default counter. |
| Errors—The number of packets received with errors. |
| Discards—The number of packets discarded by the ThreatINSIGHT Sensor. |
| Dropped—The number of packets dropped by the ThreatINSIGHT Sensor. |
The counters are aggregated by hour, day, week, or month.
To view the statistics in GigaVUE‑FM, go to the Tools page, select the ThreatINSIGHT Sensor, click the vertical ellipsis, and then select View Statistics Graph.

Note: You cannot clear these counters.
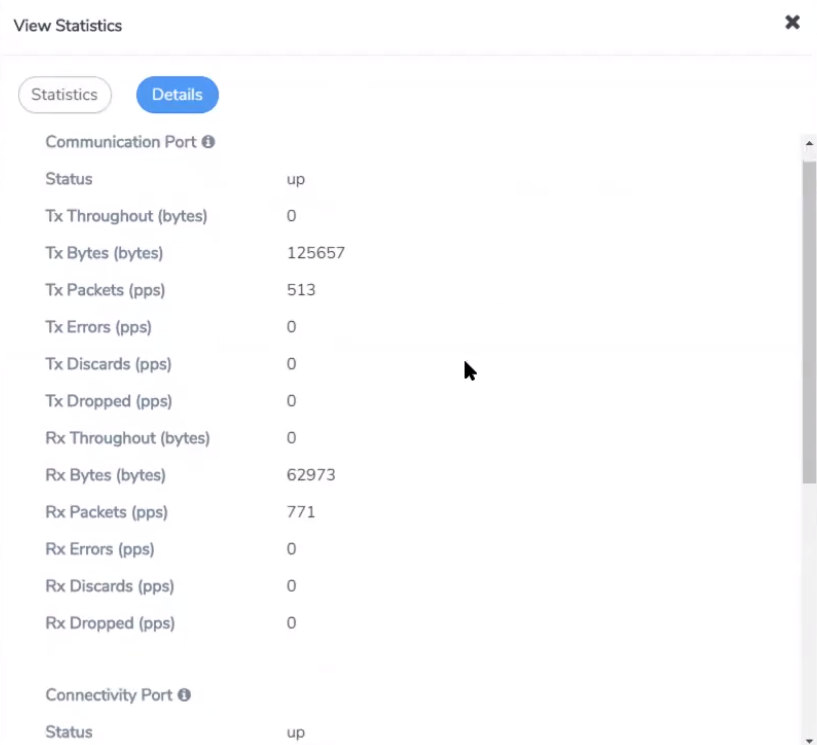
Use the Details tab in the View Statistics page to view the diagnostics statistics of the ThreatINSIGHT Sensor's Communication port (management port) and Connectivity port (stack port - eth2). These statistics gets refreshed every 10 seconds.

You can troubleshoot the ThreatINSIGHT Sensor deployment issues using the information available in the Details page in GigaVUE‑FM. To access the page, go to the Tools page, select the ThreatINSIGHT Sensor, click the vertical ellipsis, and then select View Details.
Use the ThreatINSIGHT Sensor's diagnostics statistics that appear in the Details tab in the View Statistics page to troubleshoot management issues such as:
| the ThreatINSIGHT Sensor is unable to obtain configurations from GigaVUE-FM or GigaVUE-OS CLI, |
| the ThreatINSIGHT Sensor is unable to export events to the Gigamon ThreatINSIGHT Portal, and so on. |
To view the diagnostics statistics in GigaVUE‑FM, go to the Tools page, select the ThreatINSIGHT Sensor, click the vertical ellipsis, select View Statistics Graph, and then go to the Details tab.
For more details, refer to Troubleshoot Gigamon ThreatINSIGHT Sensor Issues.


