Troubleshoot GigaSMART 5G CUPS Issues
This section lists the issues related to the GigaSMART 5G CUPS feature and steps to troubleshoot such issues. Refer to the following sections for details:
Note: To troubleshoot this issue, you must verify the following (as shown in the table) in both Control Plane Node (CPN) and User Plane Node (UPN):
|
S.No |
Tasks |
For CPN refer to.. |
For UPN refer to.. |
|---|---|---|---|
|
1 |
Verify the Traffic feed |
Traffic Feed | Traffic Feed |
|
2 |
Check the Map Configuration |
Map Configuration | Map Configuration |
|
3 |
Verify the GSParams |
GSParams | GSParams |
|
4 |
Check the Engine logs |
UPN Engine Logs | CPN: Engine logs |
|
5 |
Verify the CLI counters |
UPN CLI counters | CPN CLI counters |
|
6 |
Check the Back end Counters |
UPN Backend counters | CPN Back End Counters |
Troubleshoot GigaSMART 5G CUPS Issues
Troubleshoot Issues in UPN
In the Traffic feed, check the following:
- Ensure that the traffic is not oversubscribed in any of the tapping point, if traffic is fed from combinations of different TAs. You can verify this by checking the ingress packet rate and egress packet rate in each TA.
- Ensure that the traffic is fed in the correct order to the correlation engines.
- Check if rules are defined properly and sent to the correct tools.
In the Map Configuration, check the following:
- Check if rules are defined correctly in the first level maps ( including rule to handle fragmentation).
- Check if rules are defined correctly in the second level maps.
- Ensure that the order of maps are correct, if multiple maps are defined.
In the GSParams, check if UPN role is correctly set as ‘User’.
Check whether the engines are up.
Check the following CLI counters:
- Map Stats
- Flow ops table/session table
- Flow ops table/session table (4G CUPS)
- Listener stats
Use the following command to determine if any of the defined rules are not being affected with the traffic for both first level and second level map:
show map stats all
Problem: If the rules defined in the second level map are correct and the vport receives traffic but it does not match with the rule or the rules, check in the var/log/messages in engine to determine if the configurations ( maps ) are properly pushed to the engine or the engines. Refer to the logs at the time of configuration.
Fix:
- Reboot engine / engines.
- Remove configuration and re-configure.
Corrective Action:
Collect the logs during configuration and provide to the Customer Support for further analysis.
Use the following command to check the flow ops table/session table:
show gsgroup flow-ops-report alias <upn gsgroup> type flow-filtering any
- Check if there are any XAUI drops.
- Determine whether the following GTP-U interfaces receives traffic:
N3 for 5G CUPS
S1u or S5u for 4G CUPS
- Check if GTP-U packets are sent to collector or not received.
Fix
- If XAUI drops are found, determine the packet rate by looking at the packet rate from the engine by using the following command:
show port stats port-list <engine>
Either add one more engine to the engine group or reduce the ingress traffic. Also log into each engine and verify XAUI lane distribution of traffic.
- Based on the GTP resource statistics, try to isolate the interface that is not receiving traffic.
-
If GTP-U packets are sent to the collector, check the session table if the IP and TEID are populated correctly for the given session or if it is incomplete. If there are plenty of sessions with incomplete sessions, will need to verify CPN control plane correlation ( discussed in CPN section).
From the Flow Ops table,
Gsgroup: gsgrp, Flow Filtering Report Summary
=================================================================
        Control Tunnels             : 2
        Control & User Tunnels      : 4

        GTP Session Stats        Sessions     Tunnels
        ===================== =========== ===========
        Gn/Gp                           0           0
        S1u/S11                         2           4
        S11u/S11                        0           0
        S5/S8                           0           0
        S3/S4                           0           0
        S2b                             0           0
        Other                           0           0

        Pending Session                 0
        Control Only Session            0
Actions Required:
hc3 (config) # show fabric advanced-hash box-id 22 brief
===========================================================================================
                                    Advanced Hash Configuration
===========================================================================================
Params:        ip4  ip4  prot  prt  prt  ip6  ip6  ip6  ip6  ip6  mac  mac  eth   mpls  gtp   ing
               src  dst  src   dst  src   dst  nxt  prt  prt  src  dst  type        teid  prt
                                                   hdr  src  dst
-------------------------------------------------------------------------------------------------
                       BOX ID = 22
------------------------------------------------------------------------------------
                     On   On   On    Off  Off  On   On   Off  Off  Off  Off  Off  Off   Off   Off   Off
==========================================================================================
To check whether the connection from the CPN is established to all engines in UPN or just partial, use the following command:
show apps listener stats all
Problem: If the connection between the CPN and UPN are not established correctly, GTP-u traffic will be sent to the collector as UPN do not receive session information from CPN. The session information tells the UPN on how to treat traffic.
Fix: Verify the following in listener configuration:
| a. | Check whether the port numbers are properly defined in listener configuration and matched to the one defined in SFFP Profile in CPN. |
| b. | Check whether the transport protocol is correctly set to TCP. |
| c. | Check whether the gsgroup and IP interface are properly defined. |
Log into each engine of the UPN and issue the following command:
| a. | Go to cd /opt/gigamon/test/ |
Problem: If the counter under Received is not incremented or fail counter increments, it means CPN had stopped sending session table information to UPN. This will happen due to the following reasons:
-
The traffic feed changes in CPN.
-
The change in SFFP profile.
- Control packet rate is very high.
Issue the command ./gs_5g_test sffp-stats and check for counters.
********************** TA STATS **********************
Node Role : UPNMESSAGE STATS
Received:
Create: 0 ------------------------------> Number of sffp packets that creates sessions received by UPN
Update: 0 ----------------------------> Number of sffp packets that updates sessions received by UPN
Delete: 0 ------------------------------> Number of sffp packets that deletes sessions received by UPN.
Keep Alive: 0
Sent:
Create: 0
Update: 0
Delete: 0
Keep Alive: 0
TA MSG MEM:
TA Msg Alloc: 0
TA Msg Dealloc: 0
TCP Msgs Rcvd: 0
TX Failed:
SFFP Lookup Fails: 0
Num TCP Write Fails: 0
Num TCP TX NON EST State: 0
Fix:
Capture the output for this command multiple times and provide it to the Customer Support for further debugging along with /var/log/messages
Troubleshoot Issues in CPN
In the Traffic feed, check the following:
- Ensure that the traffic is not oversubscribed in any of the tapping point, if traffic is fed from combinations of different TAs. You can verify this by checking the ingress packet rate and egress packet rate in each TA.
- Ensure that the traffic is fed in the correct order to the correlation engines.
In the Map Configuration, check the following:
- Check if rules are defined correctly in the first level maps (including rule to handle fragmentation) and second level maps.
- Check whether all the engines are up.
In the GSParams, check the following:
- Check if CPN role is set as 5G control with correct session table limit.
- Check whether the SFFP profile is assigned to the gsgroup.
In the SFFP profile, verify the following:
- Verify whether the CPN and UPN addresses are properly defined in the N4 interface.
- Ensure that the IP addresses are correctly assigned for CPN and UPN in SFFP profile.
- Ensure that the port numbers defined in SFFP profile are correctly configured in the CPN and UPN of the GigaSMART host feature.
- Ensure that SFFP profile is added in the gsparams.
Check whether the engines are up.
Check the following CPN CLI counters:
-
Map Statistics
-
Flow ops table/session table
- Exporter Statistics
- Corrective Action:
Collect the logs during configuration and provide to the Customer Support for further analysis.
Use the following command to determine if any of the defined rules are not being affected with the traffic for both first level and second level map:
show map stats all
Problem: If the rules defined in the second level map are correct and the vport receives traffic but it does not match with the rule or the rules, check in the var/log/messages in engine to determine if the configurations ( maps ) are properly pushed to the engine or the engines. Refer to the logs at the time of configuration.
Fix:
-
Reboot engine / engines.
-
Remove configuration and re-configure.
Corrective Action:
Collect the logs during configuration and provide to the Customer Support for further analysis.
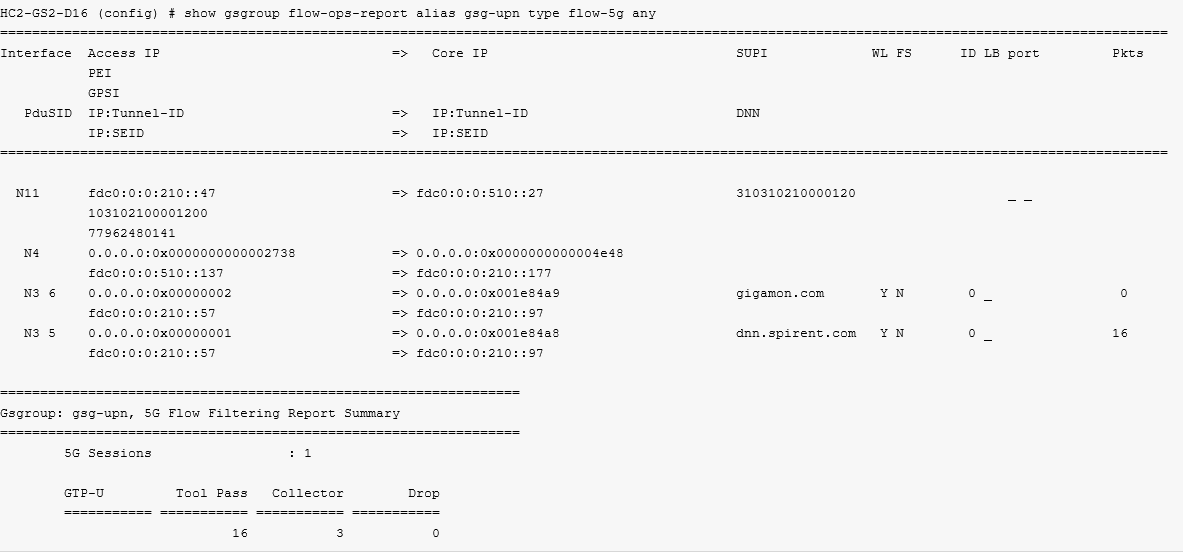
Use the following command to determine if there are any XUAI drops, and if there are N11/N4 interfaces get generated using a specific SUPI:
show gsgroup flow-ops-report alias <cpn gsgroup> type flow-5g any
Fix
| 1. | If there are XAUI drops, do the following: |
| Determine the packet rate from the engine by using the following command: |
show port stats port-list <engine>
| Verify XAUI land distribution of traffic by logging into each engine . |
| 2. | If N11/N4 messages are not properly built, either the control rate is high or all the messages are not sent to the CPN. |
| 3. | Verify if the http2 port numbers receives the traffic. The standard port number is 80. If port number 443 receives the http2 traffic, then the traffic is encrypted and the engine cannot process the traffic without decryption. You must define the gsparams with the ports that receives the http2 traffic. |
If the connections between CPN and UPN are not established correctly, CPN cannot send the session table information to all engines of the UPN, which leads to incorrect GTPU correlation. Use the following command to determine if connection from CPN is establised to all engines in UPN or only to few engines:
show apps exporter stats all
Fix:
Verify the following in the exporter configuration:
| Check if port numbers are correctly defined in exporter configuration. |
| Check if the transport protocol is correctly set to TCP. |
| Check if gsgroup and IP interface are properly define. |
You must check the following in CPN Back End Counters:
To check the SFFP statistics, login to each engine of the CPN and enter the following command:
| 1. | Go to cd /opt/gigamon/test/. |
| 2. | Check for counters. |
********************** TA STATS **********************
Node Role : CPNMESSAGE STATS
Received:
Create: 0
Update: 0
Delete: 0
Keep Alive: 0
Sent:
Create: 0 -------------------- Number of sffp packets that creates the session, are transmitted by CPN
Update: 0 ------------------- Number of sffp packets that updates the sessions, are transmitted by CPN
Delete: 0 -------------------- Number of sffp packets that deletes the sessions, are transmitted by CPN
Keep Alive: 0
TA MSG MEM:T
TA Msg Alloc: 0
TA Msg Dealloc: 0
TCP Msgs Rcvd: 0
TX Failed:
SFFP Lookup Fails: 0 ---------- N4 messages are not configured as part of SFFP profile or SFFP profile is not attached to gsgroup
Num TCP Write Fails: 0
Num TCP TX NON EST State: 0
Fix:
Capture the output of the command multiple time and provide it to the Customer Support for further analysis along with /var/log/messages.
In SFFP statistics,, you should also check the following:
| • | Transmission of SFFP packets |
| • | SFFP profile in CPN's engine |
Transmission of SFFP Packets
Problem:
- Sometimes SFFP packets transmission fail due to the following reasons, and they are identified by looking at the SFFP Profile .
| N4 IP addresses are not properly defined in SFFP profile. |
| SFFP profile is not associated to the gsgroup |
| Traffic fed to CPN is incorrect. |
- Sometimes SFFP packets transmission occurs intermittently due to high control rate. It could happen when the control packets processed by the engine is within the limits but TCP stack ( used for transmitting SFFP packets) takes more time in transmitting SFFP packets to UPN. This happen due to the delay in the transmission and reception. of TCP handshake messages
Fix
- Capture the output for the command multiple times and provide it to Customer Support for further debugging along with /var/log/messages
-
Capture the output of the commandshow apps exporter stats alias <exporter alias> tcp. This command provides detailed view of TCP information related to GS Host.
SFFP profile in CPN's engine
To check whether SFFP profile is downloaded in CPN's GigaSMART engine::
| 1. | Go to /opt/Gigamon/test/ |
Displaying the IP address in hash table
Total Number in use: 14
Total Number in Error: 0
SX Interfaces Present...
[aaa0237] 5000, [a2000002]
[fdc00000:210:0:100] 5000, [a2000002]
[fdc00000:210:0:30] 7000,7001, [a3000002]
[aa00273] 5000, [a2000002]
[fdc00000:510:0:105] 6000,6001, [a3000002]
[fdc00000:510:0:20] 5000, [a2000002]
Fix:
Check if SFFP profile is configured and associated to gsparams.
Delete the configuration, reboot the engine and re-configure.
If configured in CLI and is not displayed, then reboot the engine once and enter the command again.
To check the HTTP2 statistics,:
| 1. | Go to cd /opt/gigamon/test/. |
| 2. | check for counters.. |
====HTTP2 Session Stats====
Num of HTTP2 Active sessions : 0
Num of HTTP2 Allocated sessions : 0
Num of HTTP2 Freed sessions Frames : 0
Num of HTTP2 Allocation failed : 0 ----------- Indicate 5G License not installed or number of allocated sessions has crossed the limit
Num of HTTP2 HEADER Frames : 0
Num of HTTP2 DATA Frames : 0
Num of HTTP2 SETTINGS Frames : 0
Num of HTTP2 WINDOW Frames : 0
Num of HTTP2 PING Frames : 0
Num of HTTP2 GOAWAY Frames : 0
Num of HTTP2 PRIORITY Frames : 0
Num of HTTP2 PUSHPROMISE Frames : 0
Num of HTTP2 RESET Frames : 0
Num of HTTP2 CONTINUATION Frames : 0
Num of HTTP2 ALTSVC Frames : 0
Num of HTTP2 ORIGIN Frames : 0
Num of HTTP2 UNKNOWN Frames : 0
Num of HTTP2 HDR seg Frames : 0
Num of HTTP2 DATA seg Frames : 0
Num of HTTP2 DATA parse fail : 0
Num of HTTP2 HEADER parse fail : 0
Num of HTTP2 HDR Decomp fail : 0
Num of HTTP2 sess remove : 0
Num of HTTP2 sess add : 0
Available HTTP2 session : 2400000
Total Number of HTTP2 session : 2400000
To check the HTTP2 statistics:
| 1. | Go to cd /opt/gigamon/test/ |
| 2. | check for counters. |
====5G Msg Stats====

Num of Nsmf Create Req : 0
Num of Nsmf Modify Req : 0
Num of Nsmf Release Req : 0
Num of Nsmf SM Notify Req : 0
Num of Namf n1n2 transfer Req : 0
Num of Nsmf Create Rsp : 0
Num of Nsmf Modify Rsp : 0
Num of Nsmf Release Rsp : 0
Num of Nsmf SM Notify Rsp : 0
Num of Namf n1n2 transfer Rsp : 0
Num of Nsmf Create bad Rsp : 0
Num of Nsmf Modify bad Rsp : 0
Num of Nsmf Release bad Rsp : 0
Num of Nsmf SM Notify bad Rsp : 0
Num of Namf n1n2 transfer bad Rsp : 0
Num of Xn HO Req : 0
Num of Xn HO Rsp : 0
Num of Xn HO bad Rsp : 0
Num of N2 HO Req : 0
Num of N2 HO Rsp : 0
Num of N2 HO bad Rsp : 0
Num of active sessions : 0
Num of sessions allocated : 0
Num of sessions freed : 0Num of alloc failure : 0
Num of msg after License exceed : 0Available 5G sessions : 36000000
Total Num of 5G sessions : 36000000
To check the TCP statistics:
| 1. | Go to cd /opt/gigamon/test/ |
| 2. | Enter the command ./gs_5g_test bcp-stats –s and check for counters. |
BTCP stats:Pkts received = 0Pkts freed = 0
Pkts created for out = 0
Session allocs = 0
Session alloc fail = 0 --------> Indicates the number of TCP sessions have exceeded
Session deallocs = 0
Active sessions = 0
Accumulated sessions = 0
Closed sessions = 0
Timedout sessions = 0
Sessions killed = 0
Total Inorder Pkts = 0
Server Inorder Pkts = 0
Client Inorder Pkts = 0
Total Retransmitted Pkts = 0
Server Retransmitted Pkts = 0
Client Retransmitted Pkts = 0
Total Retransmitted Pkts = 0
Server Retransmitted Pkts = 0
Client Retransmitted Pkts = 0
Total Out-of-Order Pkts = 0
Server Out-of-Order Pkts = 0
Client Out-of-Order Pkts = 0
Session Kill Pkts = 0
Zero payload Pkts = 0
PTCP Callback invalid session = 0
No decode data = 0
Cvm Tcp Header Err pkts = 0
To check the Memory allocation:
| 1. | Go to cd /opt/gigamon/test/. |
| 2. | and check for counters. |
********** Mobility Memory *********
Node Role : 5G CPN
********** Mobility Memory Init Status **********
Common Memory Initialised
5G CPN Memory Initialised
********** Mobility Memory Allocation Status **********
5G CPN Memory Allocated
********** Mobility Memory Sequencing Status **********
Init Outstanding count: 0
********** Configured/Installed License details **********
GTP Flows = 10000000
GTP Subscribers = 12000000
5G Subscribers = 12000000
********** User GigaVUE-OS CLI/GigaVUE‑FMConfigured Memory details **********
LTE Session Limit = 05G Session Limit = 12000000
********** Final Rate Limiting Memory Units **********
GTP Max User configured = 0
5G Subscribers = 12000000
********** Current Session usage details **********
Legacy GTP or LTE CPN or UPN Sessions Usage= 0
5G Sessions usage= 0


