Troubleshoot Application Intelligence Issues
This section lists the issues related to the Application Intelligence feature and steps to troubleshoot such issues. Refer to the following sections for details:
| Application Monitoring dashboards show “No data available” |
| Application Classification Graph not shown in Monitoring Dashboard |
Problem Description: When an Application Monitoring session is created, it takes anywhere between 2 to 5 minutes to load the data on the dashboard. Sometimes the session may take longer than the said duration.
Corrective Action: Perform the following tasks to troubleshoot this issue:
| 1. | Go to Physical > Physical Nodes, and then click the Cluster ID of the node in use. |
| 2. | From the left navigation pane, click Ports > All Ports to view a list of all the ports on the node and their statuses. |
| 3. | Scroll to the source port in use and check the Admin and Link Status columns. The Admin status of the source port must be Enabled, and the Link Status must be Up. |
| 4. | Go to Ports > Fabric Statistics. |
| 5. | Scroll down to the source port in use and check the Packets/sec Rx column. |
| 6. | Click Live to refresh the counters. |
To verify that the clocks on the node and GigaVUE-FM are synchronized, you must configure the clocks on both the consoles to the same NTP server.
To enable the NTP server on the GigaVUE-OS and GigaVUE‑FM H-series node:
| 1. | Log in to the GigaVUE-OS and GigaVUE‑FM H-series node CLI console. |
| 2. | Enter the config mode by running the enable and configure terminal commands. |
| 3. | Run the following command to configure the NTP server: |
(config) # ntp server <ntp server ip>
| 4. | Run the following command to enable NTP: |
(config) # ntp enable
You can also configure the time manually. Refer to the GigaVUE-OS CLI Reference Guide for more details.
To configure NTP server on GigaVUE-FM:
| 1. | Log in to the GigaVUE-FM console through SSH. |
| 2. | Run the following command: |
fmctl jump-start
| 3. | Skip all other steps till you reach the NTP server configuration. |
| 4. | Configure the NTP server and then enable the same. |
| 5. | Exit the wizard. |
| 1. | Log in to the CLI console of the GigaVUE HC Series node. |
| 2. | Run the show arp command in the Enable mode to make sure that the communication port is reachable. |
Problem Description: Sometimes the Application Classification Graph is not displayed in the Monitoring Dashboard. How can I check if the Application Filtering Intelligence (AFI) / Application Metadata Intelligence (AMI) is configured in the device?
Corrective Action: If Application Classification Graph is not displayed, check if there are packet drops in IP interface.
To check whether the IP interface is configured:
| 1. | Select the session from the Application Intelligence Sessions pane for which you need to view the sessions details, health status and statistics, and click the ellipsis as shown: |
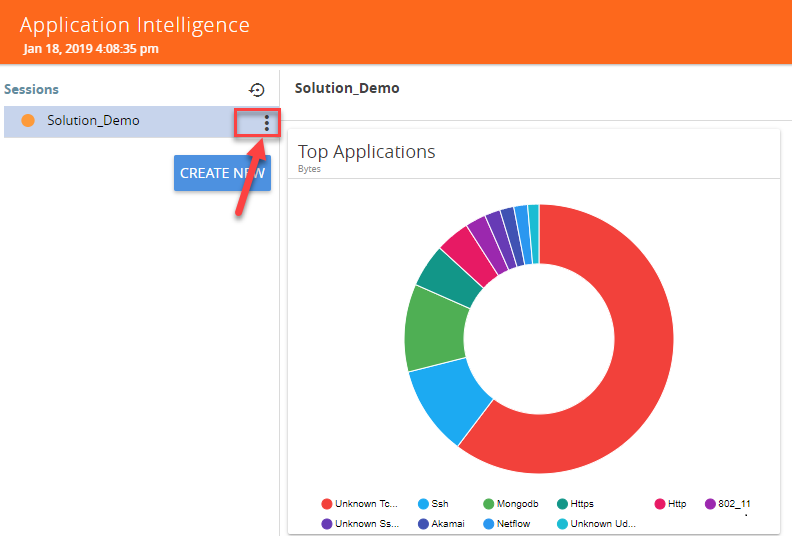
| 2. | Select View Details from the drop-down list. |
You can view the Monitoring Details, Destination Settings, Source Traffic, and Application Filtering-Destination Traffic, and Application Metadata-Destination Traffic in the Details page.
| 3. | Click Troubleshoot to view the current statistics and health status of components associated with the solution. |
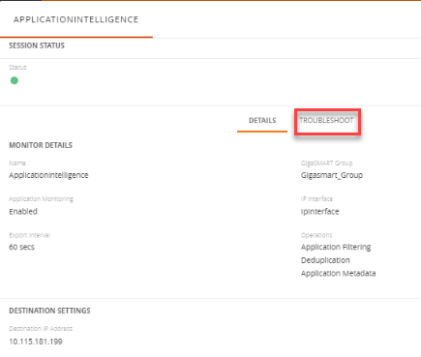
| 4. | Click IP Interface and Application Monitoring. |
|
Components |
Details of Components |
|||||||||
|---|---|---|---|---|---|---|---|---|---|---|
|
Application Monitoring |
|
|||||||||
|
Application Metadata |
|
The troubleshooting page has a flow diagram representing the components associated to the solution. Click the IP Interface block in the flow diagram to view the details of the component.
If any of the flow is blocked, you can view a red triangle on the corresponding box.
Problem: Application Filtering Intelligence graph doesn’t overall application counter increments.
Corrective Action: Application Monitoring graph displays the traffic received by GigaVUE-FM. Application Filtering Intelligence Traffic and Application Metadata Intelligence Traffic on the Dashboard provides statistics information pertaining to traffic in the device.
To check if there whether Application Filtering is configured properly:
| 1. | Select the session from the Application Intelligence Sessions pane for which you need to view the sessions details, health status and statistics, and click the ellipsis: |
| 2. | Select View Details from the drop-down list. |
| 3. | Click Troubleshoot to view the current statistics and health status of components associated with the solution. |
| 4. | Click Application Filtering > Port Statistics. |
The troubleshooting page has a flow diagram representing the components associated with the solution. Click the IP Interface block in the flow diagram to view the details of the component.
If any of the flow is blocked, a red triangle appears on the corresponding box as a warning.
Problem: There are packet drops in GigaSMART engine after deploying Application Filtering Intelligence (AFI) or Application Metadata Intelligence (AMI) solutions.
Corrective Action: This is expected. The GigaSMART engine drops the packet based on the configuration made in the engine.
Reasons for the packet drops:
| When the GigaSMART engine is configured with only AMI, it will drop packets based on the rules configured, extract only the metadata from the traffic, and export them to GigaVUE-FM. |
| When the engine is configured with both AFI and AMI, it will drop packets from irrelevant traffic per the defined configuration and will send the extracted metadata from the relevant traffic to the tools. |
When there are more packet drops than expected, contact the Customer Support team.


