Deploying Application Intelligence Solution at Scale on VMware NSX-T 3.1.3 (5.14)
Introduction
In an enterprise, up to 80% of the traffic is virtualized and therefore, it is important to ensure there are no visibility gaps in the virtual environment. Gigamon Cloud Suite offers scalable visibility solution that extends up to layer-7 and provides rich filtering capabilities to optimize the traffic before forwarding it to the monitoring tools. Enterprises can either monitor the intended applications (raw traffic) or monitor specific attributes of the applications for more targeted inspections. This Gigamon Validated Design (GVD) illustrates deploying Gigamon Cloud Suite's Application Intelligence solution on VMware NSX-T platform. This Gigamon solution supports both cluster and host-based deployment modes. Customers can configure the scale limit between 1 to N (where N is the no. of ESXi hosts in the NSX-T transport zone) for deploying the V Series nodes to acquire and process the traffic before forwarding to the tools.
Refer to Gigamon Validated Designs in the Gigamon community's knowledge base for more such designs. Please contact your Gigamon Sales contact for more information about the Gigamon solution.
Design Topology
Design Overview
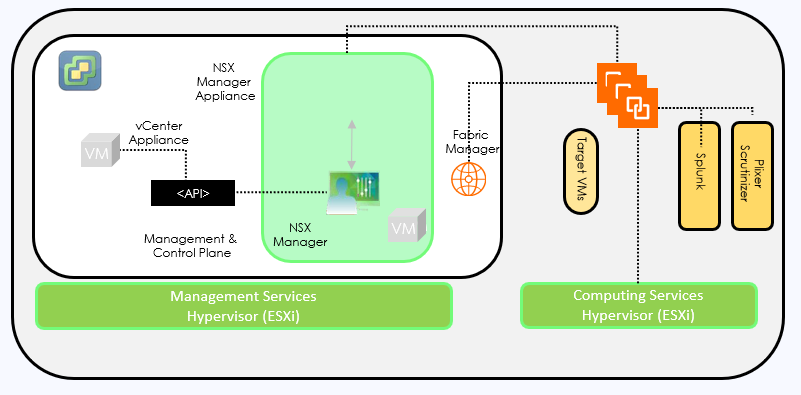
This design presumes deploying the Gigamon solution on VMware environment consisting of NSX-T version 3.1.3 and vCenter version 7.0. NSX-T services are configured on a cluster comprising of 3 ESXi hosts. The NSX-T platform integration with vCenter relies on the native VDS switch on vCenter and the overlay networking for the VMs using the segments.
Host-based deployment mode is chosen with a medium Gigamon V Series node that is deployed in the overlay transport zone to:
- Monitor and drop the duplicate traffic.
- Forward DHCP, DNS, HTTP, HTTPS, and SMB traffic over L2GRE tunnel to a Splunk instance for security event correlation.
In addition, application metadata intelligence (AMI) is deployed to export bi-directional flow records in IPFIX format to Plixer's Scrutinizer b(0,0,0);">for traffic analysis and telemetry.
Plixer recommends the below records are included as part of the exporter COLLECT configuration for in depth flow and metadata collection and analysis.
- Counter
- Bytes – 32
- Packets – 32
- Timestamp
- Sys-Uptime First
- Sys-Uptime Last
- Flow-Start Seconds
- Flow-End Seconds
- Flow-Start Milliseconds
- Flow-End Milliseconds
- Data Link
- Source MAC
- Destination MAC
- VLAN
- Interface
- Input
- Output
- IPv4
- ToS
- Protocol
- Source Address
- Destination Address
- Transport
- Source Port
- Destination Port
- UDP Source/Destination Port
- TCP Source/Destination Port
- TCP Sequence Number
- TCP Flags
- ACK
- CWR
- ECE
- FIN
- PSH
- RST
- SYN
- URG
To learn more about this solution, read complete details on the Gigamon Community: Deploying Application Intelligence Solution at Scale on VMware NSX-T-3-1-3-5-14.