Cloud Health Monitoring - Configuration Health Monitoring
GigaVUE-FM allows you to monitor the configuration health status of the entire monitoring session and also the individual fabric components for which monitoring session is configured. This feature provides detailed information about the configuration and deployment status of the deployed monitoring session.
This feature is supported for the following fabric components and features on the respective cloud platforms:
For V Series Nodes:
- AWS
- Azure
- OpenStack
- VMware
- Nutanix
For UCT-Vs:
- AWS
- Azure
- OpenStack
For Traffic Mirroring:
- AWS
For OVS Mirroring and VLAN Trunk Port:
- OpenStack
View Monitoring Session Configuration Health
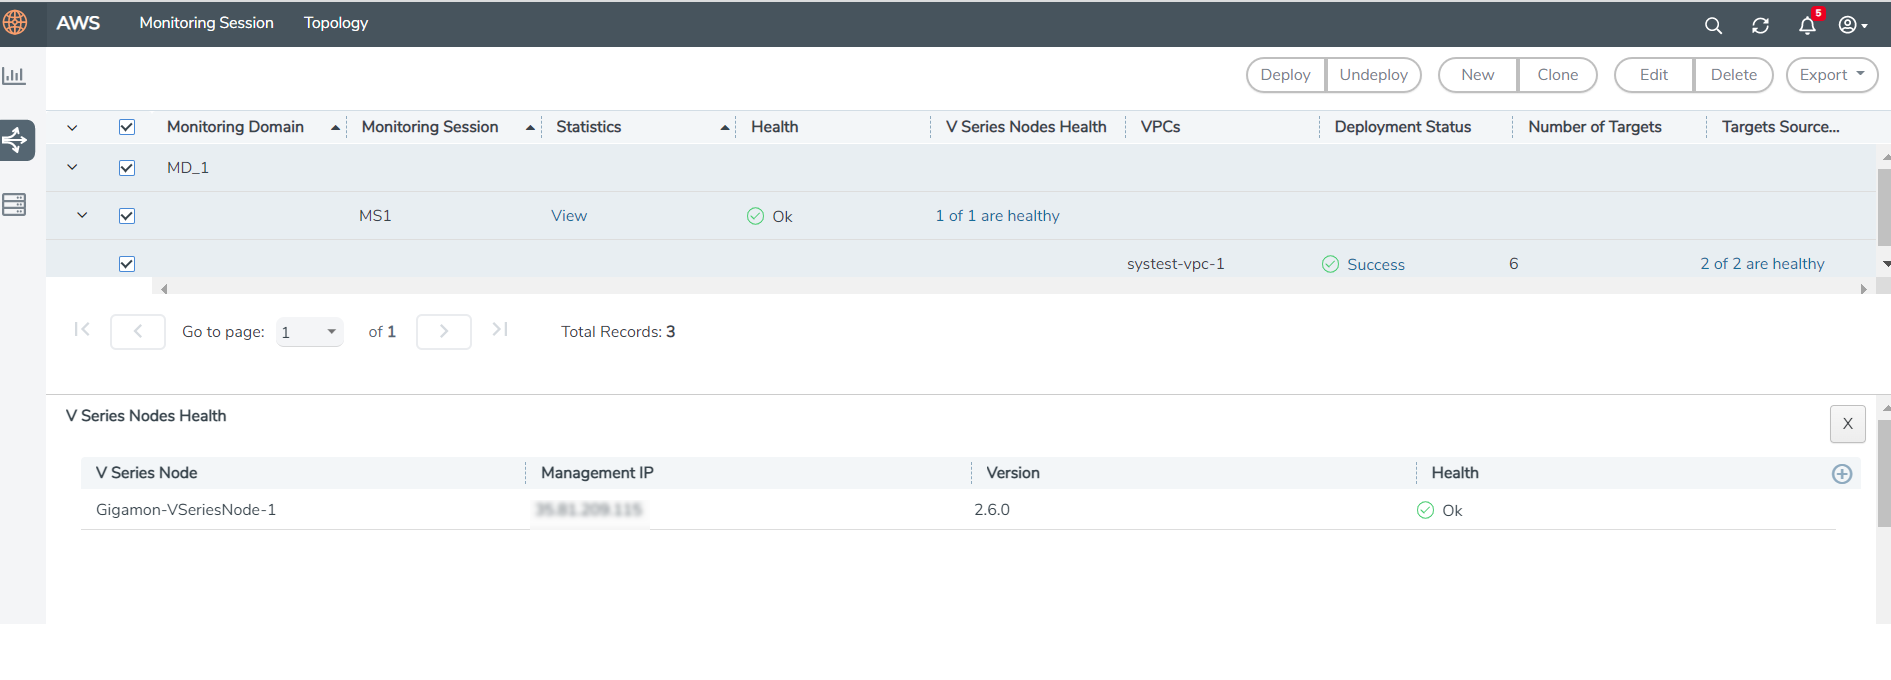
You can view the configuration status of the monitoring session and the components deployed, in the monitoring session page. This section provides information about the configuration health status of the various fabric components deployed in the monitoring session.
The following columns in the monitoring session page are used to convey the configuration health status:
Health
This column displays the configuration health status of the entire monitoring session.
The error message associated with monitoring session configuration appears when you hover over the health column. You can use the error message to help you troubleshoot and identify the components that are in conflict or mis-configured.
V Series Node Health
This column displays the configuration health status of the monitoring session deployed in V Series Nodes. This column provides information on the number of monitoring sessions successfully deployed on a particular V Series Node to the total number of monitoring session deployed on that particular V Series Node.
You can view the health status of the individual V Series Nodes and also the error message associated with them, by clicking on the V Series Node Health column.
Note: V Series node health only displays the configuration health status therefore even if the V Series Node is down it will not be reflected in the monitoring session page.

Target Source Health
This column displays the configuration health status of the monitoring session deployed in targets. This column provides information on the number of monitoring sessions successfully deployed on a particular target to the total number of monitoring session deployed on that particular target.
You can view the health status of the individual targets and also the error message associated with them, by clicking on the Target Source Health column.
View Monitoring Session Statistics
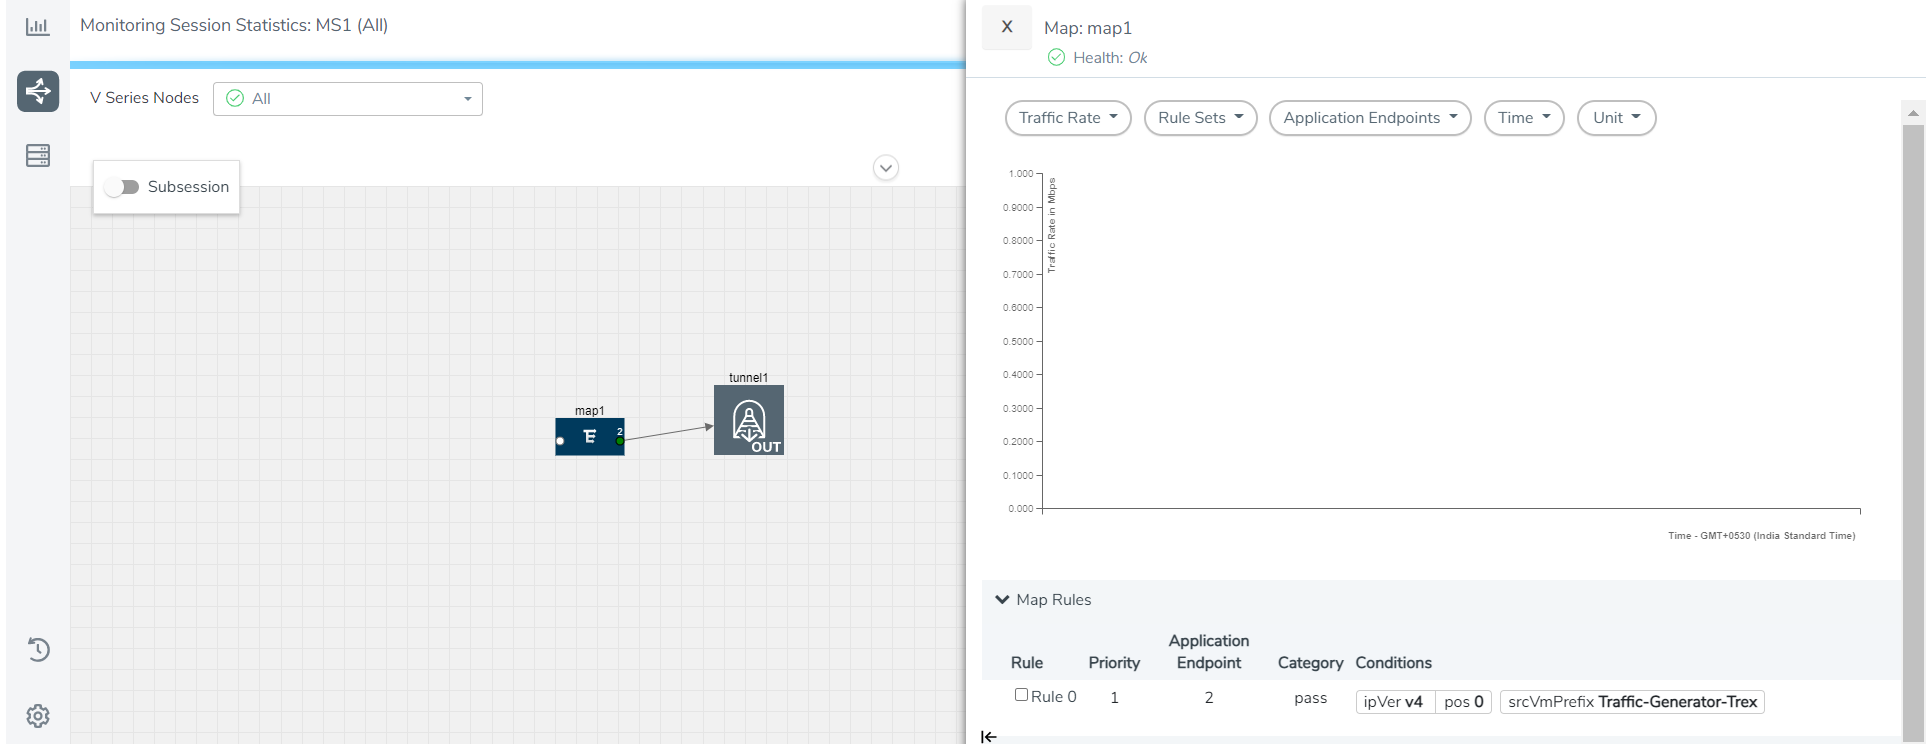
You can now view the statistics of the monitoring session deployed in the individual V Series Nodes. To view the statistics of the individual V Series Node, select the name of the V Series Node for which you want to view the statistics from the V Series Node drop-down menu on the top left-corner of the Monitoring Session Statistics page.
Hover over the V Series Node drop-down to view the number of the applications, end points, and other application environments configured for a particular V Series Node. It also displays the error message related to configuration for the particular V Series Node.
View Monitoring Session Diagram
The Monitoring Session diagram page displays the applications and end points deployed in a particular monitoring session in pictorial form. To view the statistics of a particular application or an endpoint, click on the application icon for which you want to view the statistics. You can also view the statistics of a particular application for an individual V Series Node by selecting the name of the V Series Node for which you want to view the statistics from the V Series Node drop-down menu on the top left-corner of the Monitoring Session page.
When you select a V Series Node from the V Series Node drop-down, the application icon displays the name of that particular application as configured in the V Series Node.
The subsession toggle button available in the top-left corner of the canvas allows you to view the statistics of individual paths in the monitoring session.


