Deploy Monitoring Session
To deploy the monitoring session:
- Drag and drop one or more maps from the MAP Library to the workspace.
- (Optional) To add Inclusion and Exclusion maps, drag and drop the maps from the Map Library to their respective section at the bottom of the workspace.
- (Optional) Drag and drop one or more applications from the APPLICATIONS section to the workspace.
Note: For information about adding applications to the workspace, refer to Add Applications (GigaVUE V Series 2) and Add Applications (GigaVUE V Series 1).
- Drag and drop one or more tunnels from the TUNNELS section.
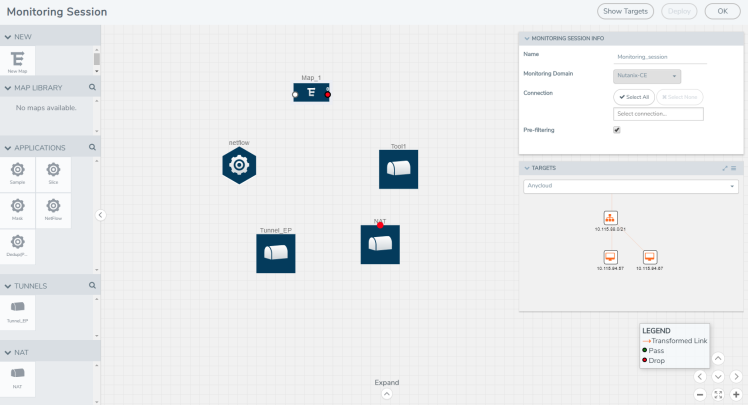
The following figure illustrates three maps, one exclusion map, one application, and two tunnel endpoints dragged and dropped to the workspace.
 You can add up to 8 links from a action set to different maps, applications, or monitoring tools.
- Hover your mouse on the map, click the red dot, and drag the link over to another map, application, or tunnel. You can drag more than one link from a map to the destination. On these links, you can apply link transformation to alter the packets. For information about adding link transformation, refer to Add Header Transformations.
- Hover your mouse on the application, click the red dot, and drag the link (arrow) over to the tunnel endpoints. The traffic matching the rules in each action set is routed to maps, applications, or monitoring tools.
- Click Show Targets to view details about the subnets and monitoring instances.The instances and the subnets that are being monitored are highlighted in orange.
- Click Deploy to deploy the monitoring session.
The status is displayed as Success in the Monitoring Sessions page. The session is successfully deployed on all GigaVUE V Series nodes and G-vTAP Agents. If the monitoring session is not deployed properly, then one of the following errors is displayed:
- Partial Success—The session is not deployed on one or more instances due to G-vTAP or GigaVUE V Series node failure.
- Failure—The session is not deployed on any of the GigaVUE V Series nodes and G-vTAP Agents.
- Click View under Statistics to view and analyze the incoming and outgoing traffic.
You can also do the following in the Monitoring Session page:
- Use the Clone button to duplicate the selected monitoring session.
- Use the Edit button to edit the selected monitoring session.
- Use the Delete button to delete the selected monitoring session.


