Explore Traffic Policy Interface
In the GigaVUE-FM Homepage, go to Traffic > Traffic Policy to view the Traffic Policy landing page as shown below.
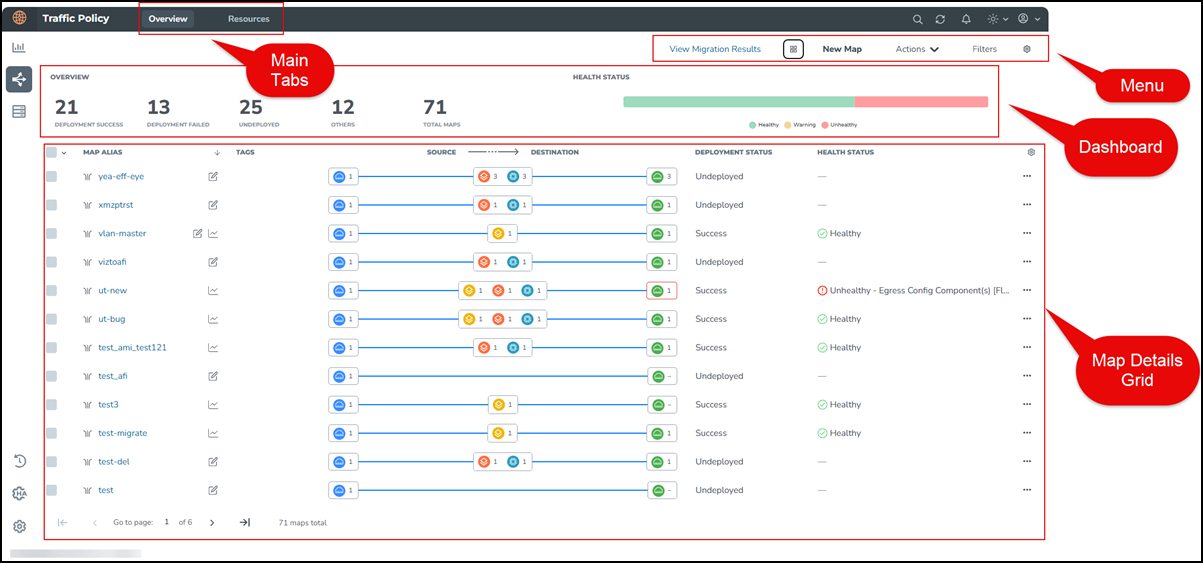
The Traffic Policy landing page includes two main tabs, namely:
| Overview |
| Resources |
In the Overview, you can view the details of the existing maps, their health status, deployment status and you can access the maps to edit, delete, clone, deploy, and undeploy, and so on. In the Resources, you can create fabric port groups and can export or import tool templates.
Overview
The Overview includes the Dashboard, Map Details Grid, and Menu including actions that can be performed in the map. The following sections explain these in detail.
| Dashboard |
| Map Details Grid |
| Menu |
Dashboard
The Dashboard provides the overview of the traffic policies and their health status. You can hide or unhide the Dashboard using the Dashboard icon ![]() in the Menu. The Dashboard section includes the Overview section and Health Status section.
in the Menu. The Dashboard section includes the Overview section and Health Status section.
| Overview section |
| Displays the total number of maps, number of maps based on the deployment status such as Success, Failed, Undeployed, and Others (status including Pending, Partial Success, and Damaged). |
Sorts the maps in the Map Details Grid based on your selection of items in the Overview section. For example, if you click the Success item, the maps with Success status are listed in the grid followed by other statuses. This section displays the selected item labels at the top of the Dashboard. The Map Details Grid displays the maps in the sorted order of selected items in the Overview section. 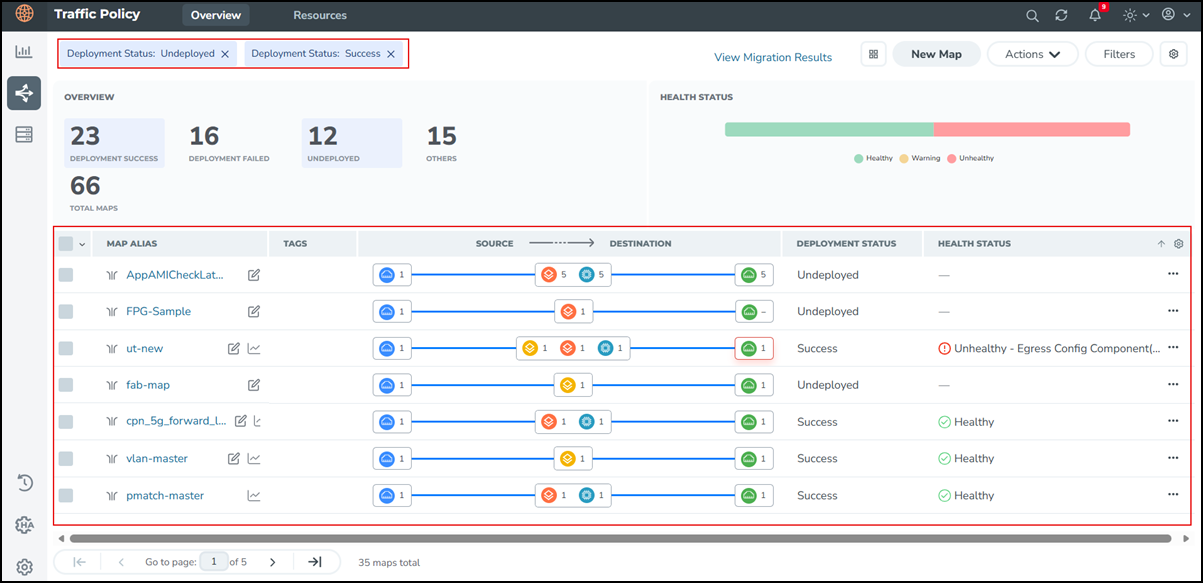 |
| Health Status section |
| Represents the overall health of all traffic policies created in the Traffic Policy interface in a color-coded horizontal bar with segments for Healthy (green), Warning (Amber), and Unhealthy (red). |
| Displays the statuses with the count, when you hover over the horizontal bar as shown below. |
Sorts the traffic policies in the Map Details Grid based on the health status you select.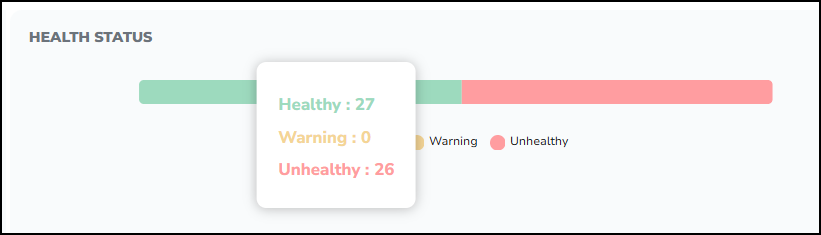 |
The following table lists the health status and its descriptions.
|
Color |
Health Status |
Description |
|---|---|---|
|
Green |
Healthy |
All components in the Traffic Policy (sources, applications, destinations) are up and passing traffic as expected. |
|
Amber |
Warning |
One or more components are in a partially available state. Traffic may be impacted, but some traffic can still flow. |
|
Red |
Unhealthy |
One or more components are down or misconfigured, and traffic is likely not flowing as expected for this policy. |
Map Details Grid
The Map Details Grid displays the maps that are created in the Traffic Policy with the tags, deployment status, health status, and so on.
The following table displays the different columns in the Map Details Grid and their description.
|
Grid Columns |
Description |
| Map Alias | Name of the Traffic Policy. |
|
Tags |
Tags linked to the Traffic Policy. To know how to create, work with and add tags to maps, refer to Tags. |
|
Source -> Destination |
Displays a visual representation of the map components that are used in the Traffic Policy.
|
|
Deployment Status |
Displays the deployment status of the Traffic Policy. Valid values are Success, Failed, Undeployed, Pending, Partial Success, and Damaged. |
|
Health Status |
Displays the health status of the Traffic Policy. Valid values are Healthy, Warning, and Unhealthy. |
|
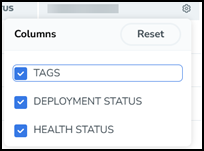
Settings |
Enables you to add or remove columns from the grid view.
|
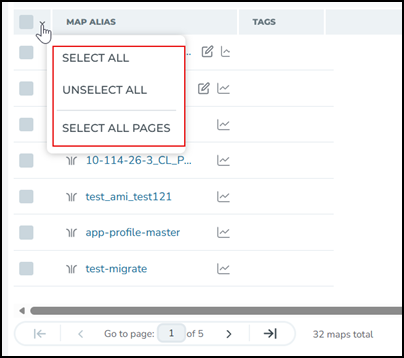
| Select All |
Enables you to select the traffic polices in the current page, select the traffic policies in all pages, or unselect all the traffic policies.
When you click the Select All Pages option, all the traffic policies in the interface are selected and Clear option is given as shown below.
|
The following table lists the possible deployment statuses for the Traffic Policy and suggested actions to be done for each status.
|
Deployment Status |
Definition |
Suggested Action |
|
Success |
The Traffic Policy was accepted at GigaVUE‑FM level and traffic flow was deployed correctly. |
No action required. Optionally verify the device‑side maps and statistics if you want to confirm counters are incrementing as expected. |
|
Failed |
The Traffic Policy was not configured correctly and not accepted or deployed at GigaVUE‑FM level. |
View Troubleshooting details for the policy to review the error message. Check device reachability and configuration (ports, GigaSMART operations, licenses). Fix the reported issue and deploy the Traffic Policy again. |
|
Pending |
The Traffic Policy deployment request is in progress or waiting for device feedback. GigaVUE‑FM has started the deployment but the final status from all devices is not yet available. |
Wait for the deployment to complete. If the status remains Pending for an extended period, verify device connectivity and job status in GigaVUE‑FM, then redeploy the Traffic Policy if needed. To redeploy the Traffic Policy, use Resubmit All option from the Actions menu. |
|
Partial Success |
The Traffic Policy was deployed successfully on some devices or components, but failed on others—for example, some maps or logical components (vPorts, GigaSMART operation chains) could not be created or synchronized. |
View Troubleshooting details for the policy to review the error message. Review per‑device or per‑component errors, and correct the failing resources (such as fixing ports, GigaSMART operation resources, or missing maps). Redeploy the Traffic Policy and confirm it moves to Success. To redeploy the Traffic Policy, use Resubmit All option from the Actions menu. |
| Undeployed | The Traffic Policy configuration exists in GigaVUE‑FM but is not currently deployed on any devices, or it has been explicitly undeployed from the devices. No traffic is being steered by this policy. |
This status applies to policies that have never been deployed which means the policy configuration is saved in GigaVUE‑FM but is not applied on the device. If you want the policy to be active, select the Traffic Policy and choose Deploy from the Actions menu or from the canvas. If the policy should remain inactive, no action is required. |
| Damaged | GigaVUE‑FM detected that the deployed state of the Traffic Policy does not fully match the intended configuration—for example, some underlying maps or components are missing or out of sync during/after deployment or configuration sync. | Use View Troubleshoot and Deployment Status to identify missing or inconsistent components. Resolve the underlying issues (for example, recreate missing maps or fix device problems) and redeploy the Traffic Policy. If the policy remains Damaged and is no longer needed, you can delete it and recreate a clean policy. |
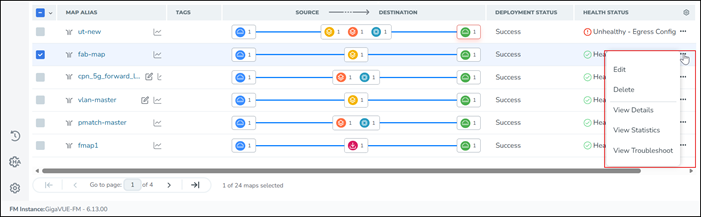
The Map Details Grid includes a Three-dots menu that enables you to edit, delete, view map details, view map statistics, and troubleshoot the Traffic Policy if there are any errors. Refer to Manage Traffic Policy for more information.
Menu
The Menu includes the following functions:
| View Migration Results |
| New Map |
| Actions |
| Filters |
| Settings |
View Migration Results
Select this to view the migration status of the existing fabric maps to traffic policies.
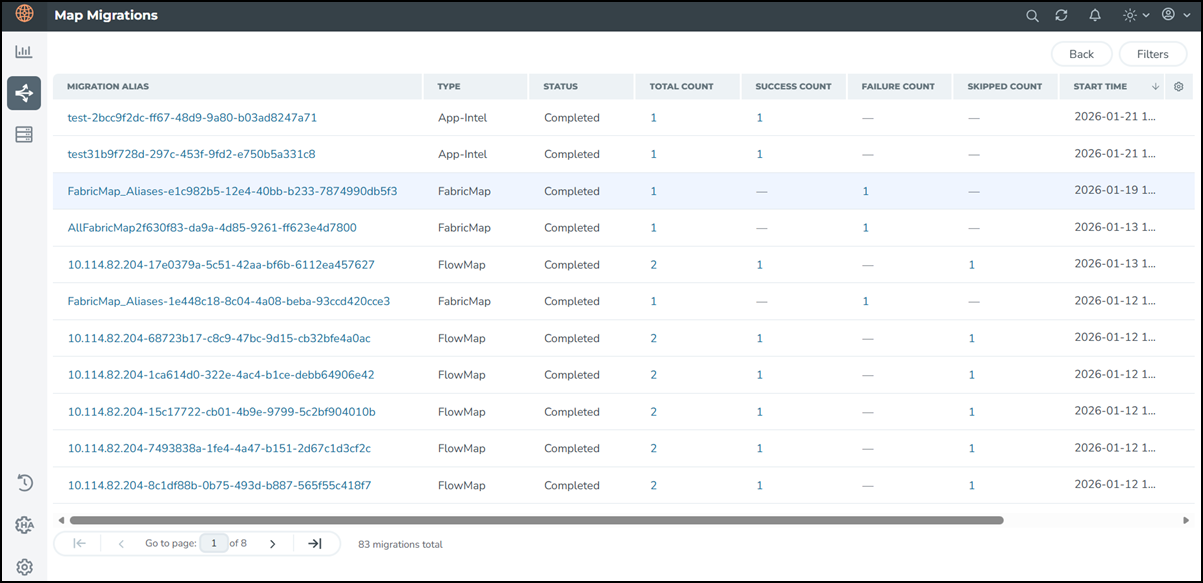
Refer to Migrate Maps to Traffic Policy for more information.
Filters
You can filter the maps based on the Alias, deployment status, health status, and tags to search for a specific map. The
To create a map filter:
| 1. | Click Filters in the top right corner of the landing page. The Map Filters page appears.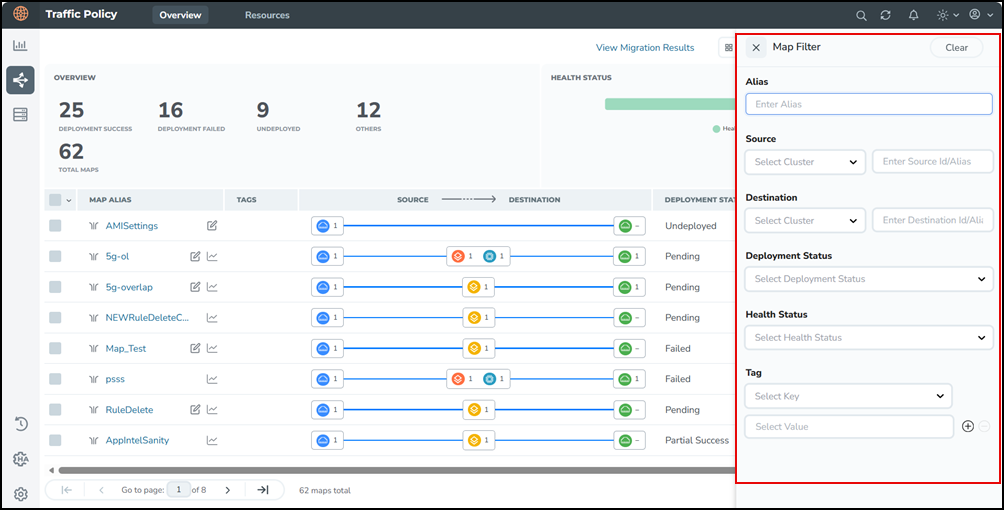 |
| 2. | Enter or select the required fields to filter the maps. The landing page displays the maps based on the filter criteria, and the selected filter criteria in the top left corner as shown below.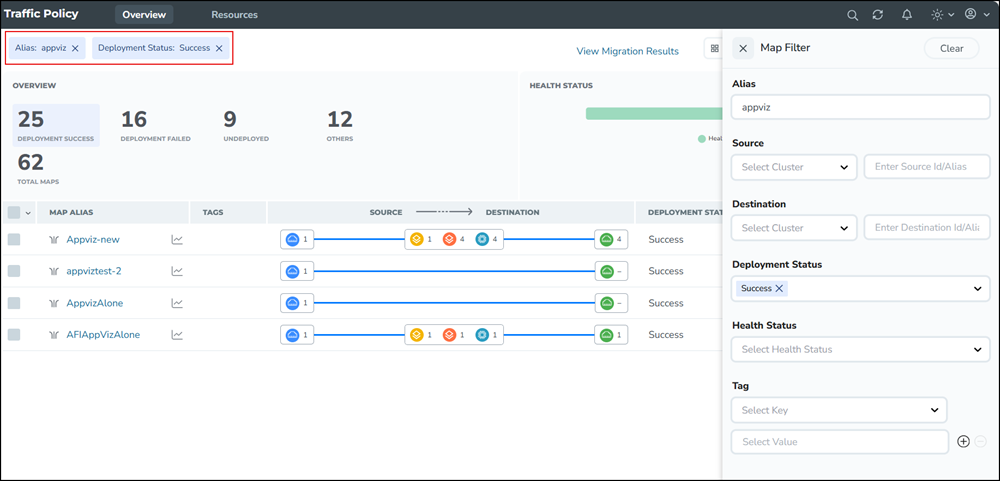 |
Note: The Alias field supports multiple entries separated by comma, and supports regex-based filtering of traffic policies.
| 3. | Select Clear to reset the filter. |
Note:
If you create a filter and log out of the GigaVUE-FM, then when you login back, the Traffic Policy landing page displays the existing maps based on the filter.
If you want to filter the traffic policy of a specific cluster, then enter the cluster ID in the Source or Destination field.
Settings
You can configure the map settings to control how resources, spine source maps, configuration synchronization, and circuit ID ranges are handled for traffic flows. Refer to Configure Map Settings topic for more information.
Actions
Select the map that you want to edit. delete, clone, deploy, undeploy, and so on and click the Actions dropdown to view the applicable options for the Traffic Policy.
Config Audit
This option enables you to conduct an audit of the map configuration. This process audits the configuration including the components of the Traffic Policy. Config audit verifies that the map configuration is active, the devices are connected, and traffic is flowing through the map with no issues.
To configure audit:
| 1. | Select the map that you want to audit. |
| 2. | Go to Actions > Config Audit. Once the audit is completed, a success message displays as shown below. |
Resubmit All
Resubmit All is a bulk retry option used for all outstanding config operations in the unified Traffic Policy framework. This option is used after you fix any deployment issues (for example, device unreachable, missing circuit/GigaStream, validation errors), to push or retry earlier failed or pending changes to the devices without changing the policy definitions themselves.
Edit
You can edit a map and it's components including the configurations of source, source ruleset, application, application ruleset and destination based on the requirement before deploying the map.
You can edit a map in two ways:
| 1. | From the Menu, click Actions > Edit or |
| 2. | Select the map to edit then click the Three-dots Menu |
Note: If you do not deploy the edited version of the map, and come back to the landing page, the Map Details Grid displays an edit icon in the Map Alias column as shown below. 
You can always edit either the deployed policy or the policy in draft mode.
Delete
You can delete a map and it's components including the configurations of source, source ruleset, application, application ruleset and destination based on the requirement before deploying the map. The delete operation removes the configuration from the device and GigaVUE‑FM.
You can delete a map in two ways:
| 1. | From the Menu, click Actions > Delete or |
| 2. | Select the map to delete then click the Three-dots Menu |
| 3. | When you select multiple maps to delete, a Delete Map dialog appears. |
| 4. | Enter Delete in the Type Delete field to delete the selected maps. |
Clone
You can clone a map and it's components based on the requirement.
You can clone a map in two ways:
| 1. | From the Menu, click Actions > Clone or |
| 2. | Select the map to delete then click the Three-dots Menu |
| 3. | Edit and rename the map in the Alias field. |
| 4. | Click Save. The cloned map opens in the map canvas. |
Deploy
To deploy a map
| 1. | From the Menu, click Actions > Deploy or |
| 2. | Select the map to deploy. The selected map appears in the map canvas with the Deploy button. |
| 3. | Click Deploy. The map is deployed successfully. |
Undeploy
The undeploy operation removes the configuration only from the device and the configuration exists in GigaVUE‑FM.
To undeploy a map
| From the Menu, click Actions > Undeploy The map is undeployed successfully. |
View Details
You can view the details of the Traffic Policy to view the map components, configuration, status, map type, map priority, and tags associated with the policy.
To view the details:
| 1. | Click the map alias or |
| 2. | Select the map you want to view the details, click Three-dots menu 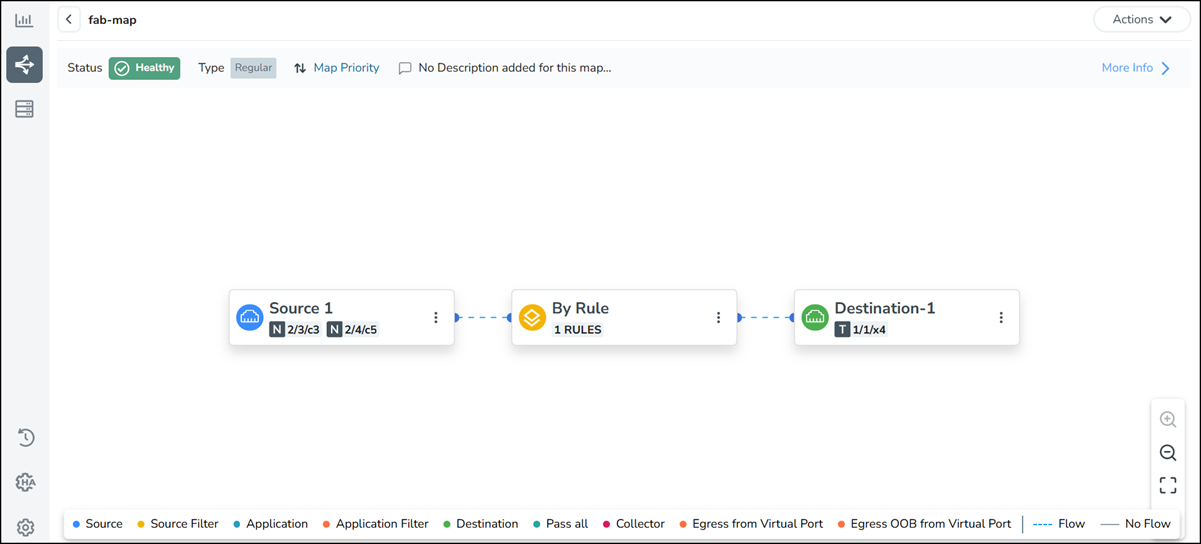 |
| 3. | Click More Info to view the details of the map components in the policy as shown below.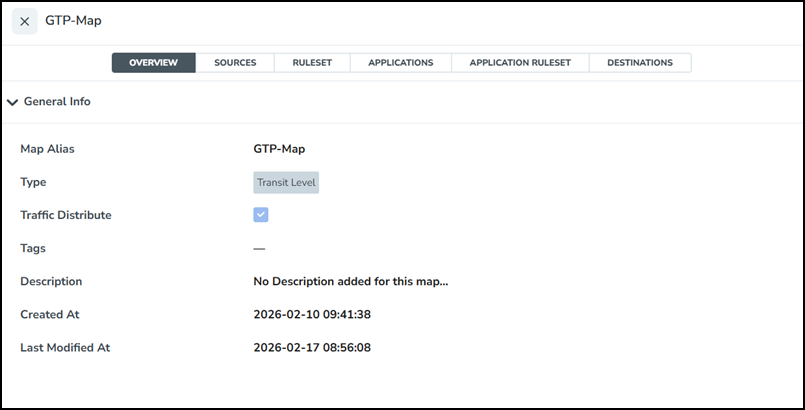 |
The Overview tab displays the general map information, such as Alias, description, and timestamps. You can select the other tabs namely Sources, Ruleset, Applications, Application Ruleset, and Destinations to view their details.
Note:
In the View mode, you can select Edit from the Actions dropdown to edit the Traffic Policy if required. When you click the Map Alias to view the map, the deployed version of the map appears.
View Statistics
This option helps you to quickly verify that a Traffic Policy is actively passing traffic and to spot drops, spikes, or anomalies without going to device‑level CLIs or separate tools.
To view the statistics information:
| 1. | Select the map and click Three-dots menu 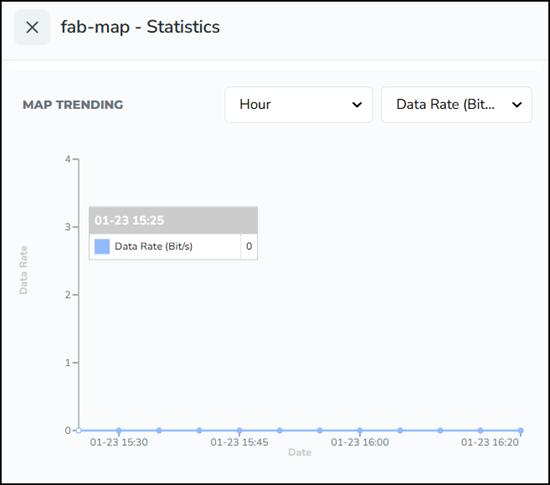 |
| 2. | Hover over the statistics graph to view the Data Rate/Packet rate values at any point of time. |
| 3. | You can change the X-axis and Y-axis values of statistics graph from the list as required. The statistics graph displays the Data Rate/Packet rate values at the selected time. 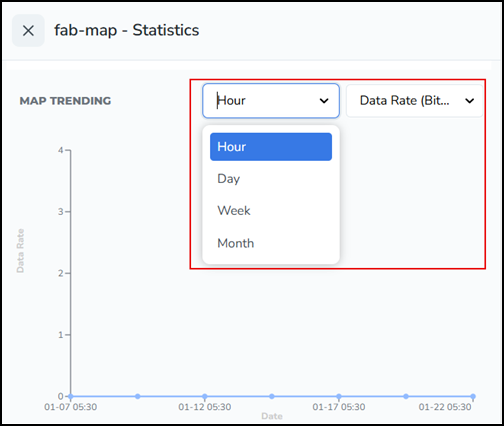 |
Note: You can also select the Statistics ![]() , to view the statistics information of the Traffic Policy. This is not applicable to maps with deployment status as Undeployed.
, to view the statistics information of the Traffic Policy. This is not applicable to maps with deployment status as Undeployed.
View Troubleshoot
Click Three-dots menu ![]() > View Troubleshoot to view the troubleshooting details of the Traffic Policy. The selected traffic policy appears in the troubleshooting mode. Select the map to troubleshoot. Refer to Troubleshoot Traffic Policy for more information on troubleshooting steps.
> View Troubleshoot to view the troubleshooting details of the Traffic Policy. The selected traffic policy appears in the troubleshooting mode. Select the map to troubleshoot. Refer to Troubleshoot Traffic Policy for more information on troubleshooting steps.
Note: You can view this option for all the traffic policies with deployment status other than Undeployed.
Resources Tab
The Resources tab of the Traffic Policy includes Fabric Port Group and Tool Templates sections. You can create and configure fabric port groups, export or import tool templates in the Resources tab. The following sections explain these in detail:
| Fabric Port Groups |
| Tool Templates |
Fabric Port Groups
A Fabric Port Group (FPG) can be defined as a logical collection of tool ports that reside on different clusters. Each of the tool port in the Fabric Port Group receives load-balanced traffic. Thus, allowing load balancing between tool ports that reside on different clusters. However, you can also use FPG within a cluster.
To know more information on creating, managing and configuring fabric port groups for a Traffic Policy refer to Create and Manage Fabric Port Group.
Tool Templates
Tool templates are pre-built profiles that define a set of applications including the metadata attributes to export to your monitoring tools. You can select the required tool template when configuring a Traffic Policy for an Application Intelligence solution, and reuse it across multiple exporters and devices.
To know more information on creating customized tool templates, refer to Create and Manage Custom Tool Template section.


