Deploy Application Metadata Exporter in VMware ESXi using Third Party Orchestration
This section outlines the workflow for deploying Application Metadata Exporter (AMX) application using Third Party Orchestration on VMware ESXi.
Predeployment Checklist:
|
1.
|
The minimum resource requirements for deploying V Series to configure AMX are as follows. You can deploy one or more V Series for deploying AMX subject to your traffic volume (flows per second). Contact Gigamon Support for sizing guidance, if needed. |
|
o
|
8 vCPUs, 16 GB memory, and 80 GB disk space for exporting Application Metadata in JSON format. |
|
o
|
40 vCPUs, 64 GB RAM, 128 GB disk space for exporting NetFlow/IPFIX records in JSON format. |
Exporting JSON records involves file read/write operations; using SSD storage is recommended.
|
2.
|
Ensure you have a valid SecureVUE Plus VBL license to deploy AMX and to export NetFlow/IPFIX records in JSON format. With any AMI entitlement (AMI SKU, ZTA bundle, or SecureVUE PLUS bundle), you are also entitled to deploy AMX. |
|
4.
|
V Series requires three interfaces for deploying AMX—management, data, and tool. It is recommended to allocate dedicated interface for each. Create three separate port groups (ESXi/vCenter) or subnets (other platforms): a Management Port Group for connectivity to GigaVUE‑FM, a Data Port Group for receiving traffic such as application metadata in CEF or NetFlow/IPFIX formats, and a Tool Port Group for exporting JSON records. |
Note: Preparing a network topology with the IP layout helps in configuration, monitoring, and troubleshooting.
|
5.
|
Select the appropriate deployment mode for the GigaVUE V Series node based on your requirements: |
|
o
|
Single physical uplink for Management, Data and Tool connectivity. |
|
o
|
Single physical uplink for Management and Tool connectivity, and another uplink for Data connectivity. |
|
o
|
(Recommended) Separate uplinks (three) for Management, Data, and Tool connectivity. |
|
6.
|
If static IP addressing is used, obtain the following details from your server team: |
|
o
|
IP addresses for the management, data, and tool interfaces. |
|
o
|
IP address of the DNS server and the gateway connected to the tool interface. |
|
7.
|
Verify whether remote web console access to the V Series is available. Console access is required for troubleshooting. If remote access is not available, request the server team to enable SSH access. |
|
8.
|
Review the deployment guide for the tool specific configuration needed to export records from AMX. Refer to AMX Tool Integration. |
|
9.
|
Review the connectivity requirements for GigaVUE‑FM, AMI, AMX, and the associated tools in your environment. Ensure that the required ports are open and any external connectivity dependencies are addressed. |
|
10.
|
Ensure that the standalone GigaVUE‑FM deployment meets the recommended requirements shown in the following table. For medium and large scale deployments, refer to Recommended Requirements for GigaVUE‑FM Deployments. This step is optional. A standalone GigaVUE‑FM instance is required only when an existing GigaVUE‑FM is not available for managing AMX. |
|
Requirements
|
Small Scale Deployment
|
|
CPU
|
|
|
CPU count(minimum)
|
2
|
|
CPU Min speed (per CPU)
|
2.30GHz
|
|
Memory
|
|
|
Memory Size
|
16GB
|
|
Disk Space
|
|
|
OS Disk Size (min)
|
40GB
|
|
Config Disk Size - 15 Days Data
|
80GB
|
|
Config Disk Size - 35 Days Data
|
160GB
|
|
Config Disk Size - Rollup 35 Days + 120 Days Rollup
|
200GB
|
|
NIC
|
1
|
|
Number of NICs
|
1GB
|
|
Management/Data
|
|
|
Appliance Scalability
|
Up to 50
|
|
Number of GigaVUE HC Series/GigaVUE TA Series Devices
|
Up to 50
|
|
Number of GigaVUE V Series Nodes
|
1 Cluster with 100 Nodes and 10000 pods with 2 rules
|
|
Number of Worker Pods monitored
|
|
Refer to the following topics to deploy AMX using Third Party Orchestration:
(Optional) Install GigaVUE-FM using ISO Image File on VMware ESXi Host
This step is optional and applies only when an existing GigaVUE-FM instance is not available.
To install:
|
1.
|
Log in to the VMware ESXi host web interface. |
|
2.
|
In the ESXi Host Client, go to Storage > Datastore browser for a datastore that is accessible to the host. |
|
3.
|
Click Upload and select the GigaVUE-FM ISO image from your local system to a suitable folder on the datastore. |
|
4.
|
After uploading the ISO image file, go to the Virtual Machines and select Create/Register VM. The New Virtual Machine wizard appears. |
|
5.
|
In the Select creation type page, select Create a new virtual machineand click Next. |
|
6.
|
In the Select a name and guest OS page: |
|
o
|
Enter a name for the virtual machine. |
|
o
|
Select the Guest OS family as Linux. |
|
o
|
Select the Guest OS version as Other Linux (64-bit). |
|
7.
|
In the Select storage page, choose the datastore where the VM files will reside and click Next. |
|
8.
|
In the Customize settings page: |
|
a.
|
On the Virtual Hardware tab, enter the following details: |
|
•
|
Click Add hard disk to add two more disks with 4GB and 40GB. |
|
b.
|
In the CD/DVD Drive, select Datastore ISO file. The Datastore browser appears. |
|
c.
|
Select the ISO image uploaded in Step 3. By default, the Connect checkbox for both Network Adapter and CD/DVD Drive is enabled. |
|
d.
|
On the VM Option tab, expand Boot Options, and under Firmware, select EFI. |
Note: If you leave the firmware as BIOS, GigaVUE-FM attempts to boot in BIOS mode, and the boot process fails .
|
9.
|
Review all settings on the Ready to complete page and click Finish to create the virtual machine. |
|
10.
|
Select the newly created VM and click Power on. |
|
11.
|
Open the VM console to monitor the boot process. It may take approximately 15–20 minutes for the VM to boot. |
Access GigaVUE-FM
|
1.
|
Log in to GigaVUE-FM using the IP address available on the ESXi web Interface. |
|
2.
|
Use the following default login Credentials: |
|
3.
|
On first login, you will be asked to change the password. Enter the current password, then set and confirm a new one. |
(Optional) Configure Role-Based Access for Third Party Orchestration
If you do not want to use an Admin Profile to deploy GigaVUE V Series through a Third Party orchestrator, you can create the required users, roles, and user groups in GigaVUE-FM.
Create a Custom User
You can add users only if you are a user with fm_super_admin role or a user with either read or write access to the GigaVUE-FM security Management category.
To add users:
|
1.
|
Go to Settings and select Authentication > GigaVUE-FM User Management > Users. |
|
2.
|
On the User page, select New User. |
|
3.
|
In the Add User page, enter the following details: |
|
o
|
Name: Actual name of the user |
|
o
|
Username: User name configured in GigaVUE-FM |
|
o
|
Email: Email ID of the user |
|
o
|
Password/Confirm Password: Password for the user. |
|
o
|
User Group: Select the desired User Group to associate the user. |
GigaVUE‑FM prompts for your password.
|
4.
|
Click Ok. The new user is added. |
Create a Custom Role and Assign the User
A user role defines permission for users to perform any task or operation in GigaVUE‑FM or on the managed device. You can associate a role with user.
Note: A user with read-only access cannot perform configurations on the screen. The menus and action buttons in the UI pages are disabled appropriately.
To create a role:
|
1.
|
Go to Settings and select Authentication> GigaVUE-FM User Management >Roles. |
|
3.
|
In the New Role page, select or enter the following details: |
- Role Name: Name of the role.
- Description: Description of the role.
- Select Permission:
From the Select Permissions tab, select Third Party Orchestration, and provide write permissions.
|
4.
|
Select Apply to save the configuration. |
Create a Custom User Group and Assign the Custom Role and the User
A user group consists of a set of roles and set of tags associated with users in that group. You can associate the user to one or more groups.
To create a new user group:
|
1.
|
Go to Settings, and then select Authentication> GigaVUE-FMUser Management >User Groups. |
|
3.
|
In the New User Group page, select Next to progress forward and Back to navigate backward. |
|
4.
|
In the Group Info tab, enter the Group Name and Description details: |
|
5.
|
In the Assign Roles tab, select the role that you want to assign to the user group. |
|
6.
|
In the Assign Tags tab, select the required tag key and tag value. |
|
7.
|
In the Assign Users tab, select the required users. |
|
8.
|
Select Apply to save the configuration. The new user group is added. |
Create Monitoring Domain to Acquire Traffic from Customer Orchestrated Source
To create a Monitoring Domain in
GigaVUE-FM:
|
1.
|
Go to Inventory > VIRTUAL > Third Party Orchestration, and select Monitoring Domain. The Monitoring Domain page appears. |
|
2.
|
On the Monitoring Domain page, select New. The Monitoring Domain Configuration page appears. |
|
3.
|
Enter a name for the Monitoring Domain. |
|
4.
|
Enter a name for the Connection. |
|
5.
|
Select Customer Orchestrated Source as the Traffic Acquisition Method. |
Create Tokens to Secure REST API and Third Party Orchestration Access to GigaVUE-FM
Use tokens when applications or users access GigaVUE-FM through REST APIs or when registering GigaVUE V Series using Third Party Orchestration. Tokens let GigaVUE-FM verify who is making the API calls and what they are allowed to do, without exposing passwords.
You can create tokens only if you are a user with fm_super_admin role or a user with write access to the GigaVUE-FM security Management category.
To create a token:
|
1.
|
Go to Settings > Authentication > GigaVUE‑FM User Management. The User Management page appears. |
|
2.
|
Select Current User Tokens from the Tokens drop-down list. |
|
3.
|
Click New Token. The New Token pop-up appears. |
|
4.
|
Enter a name for the new token in the Name field. |
|
5.
|
Enter the days until the token is valid in the Expiry field. |
|
6.
|
Select the user group for which you are privileged to access the GigaVUE-FM from the User Group drop-down list. The token inherits the read or write RBAC privileges of this group. |
|
7.
|
Select OK to generate a new token. You can copy and use the generated token to authenticate the GigaVUE-FM REST APIs. |
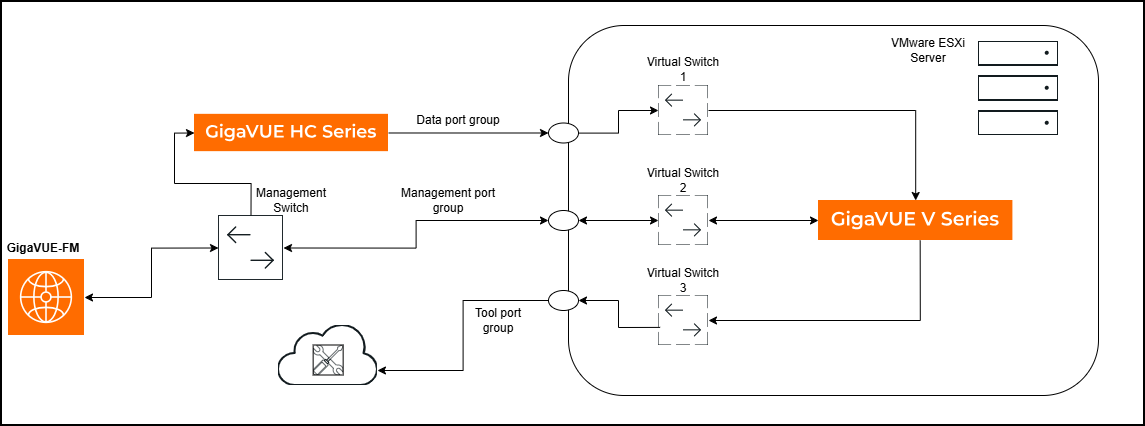
Deploy V Series Node and Register with GigaVUE‑FM
The following image illustrates a scenario for deploying and registering a GigaVUE V Series node. In this example, a GigaVUE HC Series device monitors north-south traffic and forwards Application Metadata to a SIEM/observability tool that accepts only JSON records. The entire solution is managed through GigaVUE-FM.
The GigaVUE HC Series uses Application Metadata Intelligence to generate application metadata in CEF format. Application Metadata Exporter, running on the GigaVUE V Series node, converts these CEF records to JSON before exporting them to the tool over HTTPS or Kafka.
Note: AMI is supported on both GigaVUE HC Series and GigaVUE V Series platforms. You can also deploy a separate GigaVUE V Series node to generate application metadata for monitoring east-west traffic.
To deploy and register:
|
1.
|
Log into the vSphere or VMware ESXi web interface. |
|
2.
|
Right-click the ESXi Host, Cluster or data center (if using vSphere) on which you want to deploy the GigaVUE V Series Node and then select Create/Register VM. The New Virtual Machine wizard appears. |
|
3.
|
In the Select Creation Type page, select Deploy a virtual machine from an OVF and OVA file option. Downloaded the AMX supported OVA from the VUE Gigamon Community portal. Extract the OVA to obtain the OVF and VMDK files, then select vseries-node-file-ovf15.ovf (AMX‑supported OVF that brings up three interfaces) for the AMX deployment. |
|
4.
|
Click Next. The Select OVF and VMDK files page appears. |
|
5.
|
In the Select and VMDK files page, enter a unique name for the virtual machine and upload the .ovf and .vmdk files from your local machine. |
|
6.
|
Click Next and the Select storage page appears. |
|
7.
|
Select a datastore where the virtual machine’s files will be stored. |
|
8.
|
Click Next. The Deployment Options page appears. |
|
9.
|
In the Deployment Options page, select the management port, data port, and tool port as referenced in the prerequisites. |
|
a.
|
Select the Deployment Type from the list: |
|
•
|
Do Not Use DHCP – Select this option if you want to use static IP addresses for the management, data, and tool ports. |
|
•
|
Management, Data and Tool Port DHCP – Select this option if you want to use dynamic IP addresses for the management, data, and tool ports. |
|
•
|
Management Port DHCP – Select this option if you want to use dynamic IP address only for the management port. |
|
•
|
Tool Port DHCP - Select this option if you want to use dynamic IP address only for the tool port. |
|
•
|
Data Port DHCP – Select this option if you want to use dynamic IP address only for the data port. |
|
b.
|
Select Thin/Thick in the Disk Provisioning field. |
|
c.
|
Unselect the Power on automatically check box. This is selected by default. It is recommended to disable the Power on automatically option and review all configuration before switching on the virtual machine. |
|
10.
|
Click Next. The Additional Settings page appears. |
|
11.
|
Do the following configuration in the Additional Settings page. |
|
a.
|
In the System section, enter the hostname of the V Series node instance in the Hostname field and create a new admin password for the V Series node instance in the Administrative Login Password field. |
This credential will be used for V series SSH access. The default username is gigamon. If the deployment fails, you can login to V Series SSH/Console and check the logs for troubleshooting.
|
b.
|
In the Network Connectivity section, enter the required fields based on the selected network configuration. |
Note: Ensure to unselect the Management Port DHCP checkbox if you want to use static IP address for the management port. If you select the Management Port DHCP checkbox, dynamic IP address will be configured for the management port even if you have selected Do Not Use DHCP option in the Configuration page.
|
c.
|
Enter the required value in the Management Port MTU size in bytes field. The default value is 1500B. |
|
d.
|
Enter the DNS server address in the Nameserver field to resolve the domain name of the tool destination URL. |
|
g.
|
Enter the GigaVUE-FM IP address and remote port in the RemoteIP and RemotePort fields respectively. In case of any error, you should re-deploy the V Series. |
|
h.
|
In the Custom node properties field enter app_mode=linux_apps (mandatory). |
|
12.
|
Click Next and the Ready to complete page appears. |
|
13.
|
Review all the entered information and modify the configuration if required. |
|
14.
|
Click Finish. When the operation completes, you have successfully deployed a GigaVUE V Series Node. |
Verify GigaVUE V Series Node Registration
During the initial bring up, the V Series reboots multiple times for initialization. After few minutes, you can check the status of the deployment in GigaVUE-FM. If the status is failed, you can check the logs to perform troubleshooting.
To check the logs:
|
1.
|
Log in to V Series Node via console or SSH to management IP address. |
|
2.
|
Enter the below path in the terminal to check the registration details. |
tail -f /var/log/vseries-node-reg.log
A single AMX instance processes traffic within the published performance KPIs. Deploy additional instances when traffic volume exceeds these thresholds or when packet drops occur, or CPU or memory utilization remains consistently high, to maintain stable and efficient performance. For details regarding performance KPIs, Contact Technical Support.
Create a Monitoring Session to Configure Application Metadata Exporter
In GigaVUE-FM, you must do the following to configure the Application Metadata Exporter application in the Monitoring Session.
|
1.
|
Access the Monitoring Session Page: |
|
a.
|
In GigaVUE-FM, go to Traffic > Virtual > Orchestrated Flows > Third Party Orchestration. |
|
b.
|
After creating a new Monitoring Session or on an existing Monitoring Session, navigate to the TRAFFIC PROCESSING tab. The GigaVUE-FM Monitoring Session canvas page appears. |
|
2.
|
Create an ingress REP: |
|
a.
|
In the canvas, from the New expand menu, drag and drop New Raw Endpoint to the graphical workspace. |
|
b.
|
On the new raw endpoint icon, select the  menu button and select Details. menu button and select Details.
The Raw quick view page appears. |
|
c.
|
Enter the Alias and Description details for the Ingress Raw End Point and click Save.
|
|
a.
|
In the canvas, from the Applications expand menu, drag and drop AMX to the graphical workspace. |
|
d.
|
Create a link between the ingress REP and Application Metadata Exporter application. |
|
a.
|
From the New expand menu, drag and drop New Raw Endpoint to the graphical workspace. |
|
b.
|
On the new raw endpoint icon, select the menu button and select Details.
The Raw quick view page appears. |
|
c.
|
Enter the Alias and Description details for the Egress Raw End Point and click Save.
|
|
d.
|
Create a link between the Application Metadata Exporter application and egress REP |
Configure Ingestor in AMX to Process Traffic
The following scenarios provide more information about the different ways to configure Ingestor AMX:
Scenario 1 - Export Application Metadata in JSON format over HTTPS/Kafka
Refer to Application Metadata Exporter - Export Scenarios topic for more details and conceptual information.
To configure ingestor for AMI:
|
1.
|
On the AMX quick view in the Ingestor section, enter an alias name for the ingestor. |
|
2.
|
In the Type field, select AMI as the input type. |
|
3.
|
Enter the port number on which Application Metadata must be ingested. The default port value is 514. |
|
4.
|
Click  to add another ingestor to add multiple inputs to the AMX application and click to add another ingestor to add multiple inputs to the AMX application and click  to remove an existing ingestor. to remove an existing ingestor. |
Scenario 2 - Export GigaVUE Enriched Metadata for Mobile Networks and Export over HTTPS/Kafka
Refer to Application Metadata Exporter - Export Scenarios topic for more details and conceptual information.
To export GigaVUE Enriched Metadata for Mobile Workloads:
|
1.
|
On the AMX quick view in the Ingestor section, enter an alias name for the ingestor. |
|
2.
|
In the Type field, select AMI as the input type. |
|
3.
|
Enter the port number on which Application Metadata must be ingested. The default port value is 514. |
|
4.
|
Click to add another ingestor. |
|
5.
|
In the Type field, select Mobility Control Plane as the input type. |
|
6.
|
Enter the port number on which application metadata must be ingested. |
|
7.
|
Click again to add another ingestor to add multiple inputs to the AMX application and click to remove an existing ingestor. |
|
8.
|
In the Metadata Enrichment section, enter a unique name for the enrichment. |
|
9.
|
Select the Enable option to enable the enrichment. |
|
10.
|
Select Mobility from the Type drop‑down menu. |
|
11.
|
Select the required attributes from the list. You can use Select All to choose all available attributes. Refer to the for more details. |
Scenario 3 - Export GigaVUE Enriched Metadata for Cloud Workloads and Export over HTTPS/Kafka
Refer to Application Metadata Exporter - Export Scenarios topic for more details and conceptual information.
To export GigaVUE Enriched Metadata for Cloud Workloads:
|
1.
|
On the AMX quick view in the Ingestor section, enter an alias name for the ingestor. |
|
2.
|
In the Type field, select AMI as the input type. |
|
3.
|
Enter the port number on which Application Metadata must be ingested. The default port value is 514. |
|
4.
|
Click to add another ingestor. |
|
5.
|
In the Type field, select Mobility Control Plane as the input type. |
|
6.
|
Enter the port number on which Application Metadata must be ingested. |
|
7.
|
Click again to add another ingestor to add multiple inputs to the AMX application and click to remove an existing ingestor. |
|
8.
|
In the Metadata Enrichment section, enter a unique name for the enrichment. |
|
9.
|
Select the Enable option to enable the enrichment. |
|
10.
|
Select Workload from the Type drop down menu. |
|
11.
|
Select the platform as VMware VCenter from the drop down list. |
|
12.
|
Select the required attributes from the list. You can use Select All to choose all available attributes. Refer to the for more details. |
Scenario 4 - Transform NetFlow/IPFIX records to JSON format and export over HTTPS/Kafka
Refer to Application Metadata Exporter - Export Scenarios topic for more details and conceptual information.
To configure ingestor for NetFlow/IPFIX:
|
1.
|
On the AMX quick view in the Ingestor section, enter an alias name for the ingestor. |
|
3.
|
Enter the port number on which NetFlow/IPFIX must be ingested. The default port value is 2055. |
|
4.
|
Click  to add another ingestor to add multiple inputs to the AMX application and click to remove an existing ingestor. A maximum of 12 NetFlow/IPFIX type ingestors can be configured per deployment. to add another ingestor to add multiple inputs to the AMX application and click to remove an existing ingestor. A maximum of 12 NetFlow/IPFIX type ingestors can be configured per deployment. |
Note: If you select NetFlow/IPFIX as the ingestor type, Metadata Enrichment is disabled by default. Metadata Enrichment is not supported for NetFlow/IPFIX inputs.
Integrate AMX with Third Party Tool
This section explains how to set up the third‑party tool and configure the exporter settings required to route application metadata attributes for analysis and visualization.
Set up the Third Party Tool for AMX Integration
You must set up the third party tools to ingest and visualize application metadata.
Refer to AMX Tool Integration for configuration guidance and the verification steps required to confirm that data export and visualization are functioning correctly.
Configure Exporter to Export Attributes to Third Party tools
AMX supports the following types of exporters:
Configure Cloud Tool Exporter
To configure Cloud Tool Export settings in AMX:
Deploy the Monitoring Session
|
1.
|
Click Deploy from the Actions menu. |
|
2.
|
The Select nodes to deploy the Monitoring Session dialog box appears. Select the GigaVUE V Series Node for which you wish to map the interfaces and deploy the Monitoring Session. |
|
3.
|
Select the interfaces for the ingress and egress REPs configured in the Monitoring Session. |
|
4.
|
Select Deploy. Once deployed, the status is displayed as Success in the Monitoring Sessions Sources tab. The session is successfully deployed on the selected V Series Node. |
Cloud Tool Exporter - Field References
|
Fields
|
Description
|
|
Alias
|
Enter the alias name for the cloud tool export.
|
|
Endpoint
|
Enter the endpoint URL where the cloud tool instance is installed and the ports are configured.
Enable Secure Endpoint option to hide the API keys from the URL.
Example:
|
●
|
Normal Endpoint: http://examples.com/mykey/key123 |
|
●
|
Masked Endpoint: http://examples.com/mykey/****
|
|
|
Headers
|
Enter the custom header value of the cloud tool instance.
Example: Add Content-Type: application/json in a separate header field. Ensure that the Secure Keys option is enabled.
|
| Type
|
Select any one of the following:
AMI - Select this option to export AMI.
Mobility Control- Select this option to export control plane metadata.
AMI Enriched - Select this option to export enriched metadata for cloud workloads.
NetFlow/IPFIX - Select this option to transform NetFlow/IPFIX records to JSON format.
|
|
Labels
|
Click Add. Enter the following details:
Note: Refer to the deployment guides of the respective cloud tools for configuring the Key and Value.
|
|
Advanced Settings
|
|
Enable Export
|
Enable the box to export the Application Metadata Intelligence output in JSON format.
|
|
Format
|
The default output format is JSON.
|
|
Zip
|
Enable the box to compress the output file.
Note: Enable this field when using New Relic as the cloud tool.
|
|
Interval (sec)
|
The time interval (in seconds) in which the data should be uploaded periodically. The recommended minimum time interval is 10 seconds and the maximum time interval is 90 seconds.
|
|
Parallel Writer
|
Specifies the number of simultaneous JSON exports done.
|
|
Export Retries
|
The number of times the application tries to export the entries to Cloud Tool. The recommended minimum value is 4 and the maximum is 10.
|
|
Max Entries
|
The number of JSON entries in a file. The maximum number of allowed entries is 20000 and the minimum is 10, however 1000 is the default value.
|
|
Backoff Reset Window
|
The time interval (in seconds) for which the exporter stops sending entries after it has exhausted the configured Export Retries. During this window, it does not attempt further exports. The default setting is 0, and the Backoff Reset Window is disabled at this value.
|
|
Request Timeout
|
This is the time exporter waits for a response back from the tool. The default value is 10 seconds.
|
| Source IP Address
|
Source IP Address is needed when the egress interface is configured with multiple IP addresses. Configure the source IP address which is connected to the Cloud Tool. Both IPv4 and IPv6 are supported. This field is optional. |
Configure Kafka Exporter
To configure Kafka Export settings in AMX:
Deploy the Monitoring Session
|
1.
|
Click Deploy from the Actions menu. |
|
2.
|
The Select nodes to deploy the Monitoring Session dialog box appears. Select the GigaVUE V Series Node for which you wish to map the interfaces and deploy the Monitoring Session. |
|
3.
|
Select the interfaces for the ingress and egress REPs configured in the Monitoring Session. |
|
4.
|
Select Deploy. Once deployed, the status is displayed as Success in the Monitoring Sessions Sources tab. The session is successfully deployed on the selected V Series Node. |
Kafka Exporter - Field References
|
Fields
|
Description
|
|
Alias
|
Enter the alias name for the Kafka Export.
|
|
Topic
|
The topic name to push JSON streams to, which is generally given to users part of the Kafka administration. |
| Type
|
Select any one of the following:
AMI - Select this option to export AMI.
Mobility Control - Select this option to export control plane metadata.
AMI Enriched - Select this option to export enriched metadata.
NetFlow/IPFIX - Select this option to export NetFlow/IPFIX ingestor types.
|
|
Brokers
|
The URL that contains the Kafka cluster endpoints. Click  to add another broker and click to add another broker and click  to remove an existing broker. to remove an existing broker. |
|
Labels
|
Click Add. Enter the following details:
|
|
Advanced Settings
|
|
Enable Export
|
Enable the box to export the Application Metadata Intelligence output in JSON format.
|
|
Format
|
The default output format is JSON.
|
|
Zip
|
Enable the box to compress the output file.
|
|
Interval
|
The time interval (in seconds) in which the data should be uploaded periodically. The recommended minimum time interval is 10 seconds and the maximum time interval is 90 seconds. The default time interval is 30 seconds.
|
|
Parallel Writer
|
Specifies the number of simultaneous JSON exports done.
|
|
Export Retries
|
The number of times the application tries to export the entries to Kafka. The recommended minimum value is 4 and the maximum is 10.
|
|
Max Entries
|
The number of JSON entries in a file. The maximum number of allowed entries is 20000 and the minimum is 10, however 1000 is the default value.
|
|
Backoff Reset Window
|
With a non-zero value, the exporter keeps trying to reach the tool as many times as the retry. The default setting is 0, and the Backoff Reset Window is disabled at this value.
|
| Source IP Address
|
Source IP Address is needed when the egress interface is configured with multiple IP addresses. Configure the source IP address which is connected to the Kafka Broker. Both IPv4 and IPv6 are supported. This field is optional. |
| Producer Configurations |
Click Add to enter the authentication details if a Kafka broker needs authentication.
For Example:
-
security.protocol=SASL_SSL
-
sasl.mechanism=PLAIN or sasl.mechanisms=PLAIN
- sasl.username=username
- sasl.password=password
|
Verify Your Deployment
You can view the Ingestor, Exporter and Enrichment statistics for the deployed Monitoring Session in the TRAFFIC PROCESSING tab. For more details, refer to View Application Statistics for Application Metadata Exporter.


