View Application Statistics for Application Metadata Exporter
You can view the application Statistics for the Application Metadata Exporter application.
Follow these steps:
- Go to Traffic > Virtual > Orchestrated Flows > Select your cloud platform. The Monitoring Sessions Overview page appears.
- Navigate to the TRAFFIC PROCESSING tab.
- In the canvas page, click the
 menu button on the AMX application and select Details. The Application quick view appears.
 - Select the STATISTICS tab.
- From the V Series Nodes drop-down menu, select the desired Node to view the statistics of a particular GigaVUE V Series Nodes.
- Select the IP address of the GigaVUE V Series Node from the V Series Node IP drop-down menu to view the Ingestor and Attributes Enrichment statistics.
- View the following in the Application Metadata Exporter application statistics page:
- Exporter - Statistics to monitor exports from AMX
- Name - Displays the name of exporters created for this application.
- Exported Entries - Displays the number of entries available in the files that will be uploaded from AMX to the cloud tool or the Kafka consumers.
- Average File Size - Displays the average size of the file.
- File Uploads - Displays the number of file uploaded from the AMX to the cloud tool or the Kafka consumers.
- File Upload Errors - Displays the number of times the file was not uploaded to the cloud tools or Kafka consumers due to errors.
Ingestor - Statistics to monitor ingestion
- Name - Displays the name of the ingestor created for this application.
- Packets Received - Displays the packets received from the AMI to AMX ingestor.
- Packets Dropped - Displays the packets dropped when the traffic passes from AMI to AMX ingestor.
- Octets Received - Displays the octets received from the AMI to AMX ingestor.
- Octets Dropped - Displays the octets dropped when the traffic passes from AMI to AMX ingestor.
- Records Added - Displays the number of workload information pulled from the workload environment.
- Records Dropped - Displays the number of the workload details that were dropped from the workload environment.
- Request Success - Displays if the workload information was fetched from the cloud environment. The default interval at which the AMX fetches the workload information is 60 seconds.
- Request Authentication Errors - Displays if the workload information was not fetched from the cloud environment due to any authentication errors like wrong password.
- Request Timedout Errors - Displays if the workload information was not fetched from the cloud environment even after the default interval of 60 seconds.
- Request Errors - Displays when the workload information could not be fetched from the cloud environment due to issues other than authentication failures or timeout conditions.
- Decode Success - Displays number of successful decoding operations performed by a system when processing NETFLOW/IPFIX packets.
- Decode Fail - Displays the number of failed attempts to decode NETFLOW/IPFIX packets.
- Elements Skipped - Displays number of data elements that were not processed or were omitted during the NETFLOW/IPFIX ingestion process.
Attributes Enrichment
- Name - Displays the name of the Metadata enrichment.
- One Min Percent - Displays the percentage of the traffic that is enriched from the last 1 minute.
- Five Min Percent - Displays the percentage of the traffic that is being enriched from the last 5 minutes.
- Ten Min Percent - Displays the percentage of the traffic that is being enriched from the last 10 minutes.
The below image shows the statistical details for general AMX application.
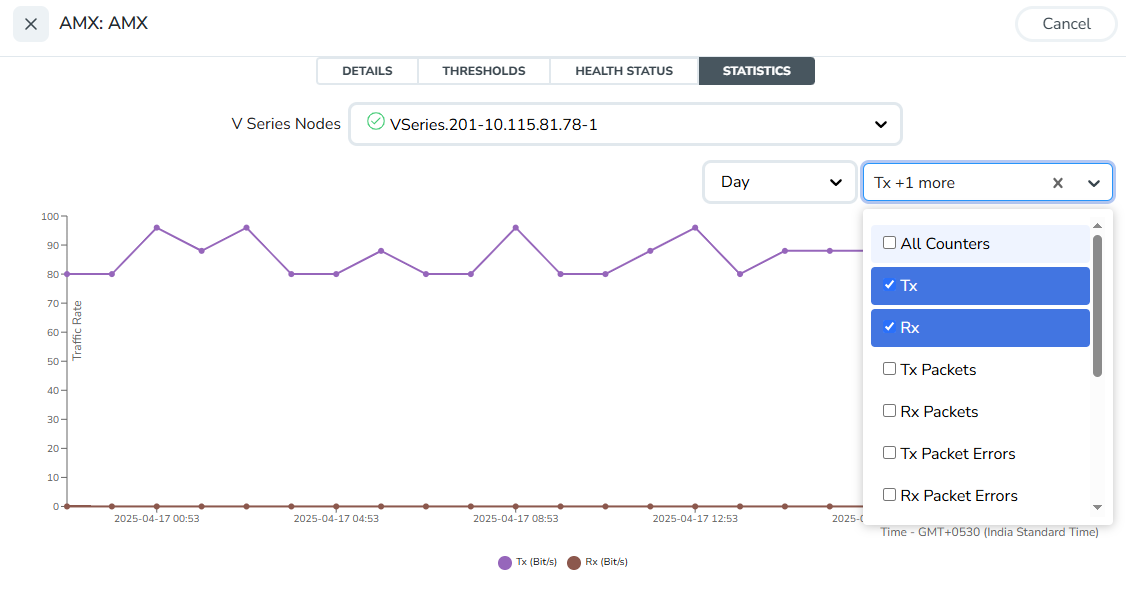
- Exporter - Statistics to monitor exports from AMX


