About Events
The Events page displays all the events occurring in the virtual fabric component, VM Domain, and VM manager. An event is an incident that occurs at a specific point in time. Examples of events include:
- Cloud provider License Expiry
- UCT-V Inventory Update Completed
- Cloud provider Connection Status Changed
An Alarm is a response to one or more related events. If an event is considered of high severity, then GigaVUE‑FM raises an alarm. An example of alarm is your cloud provider license expiry.
The alarms and events broadly fall into the following categories: Critical, Major, Minor, or info.
Access Event
Navigate to Dashboard > SYSTEM > Events. The Event page appears.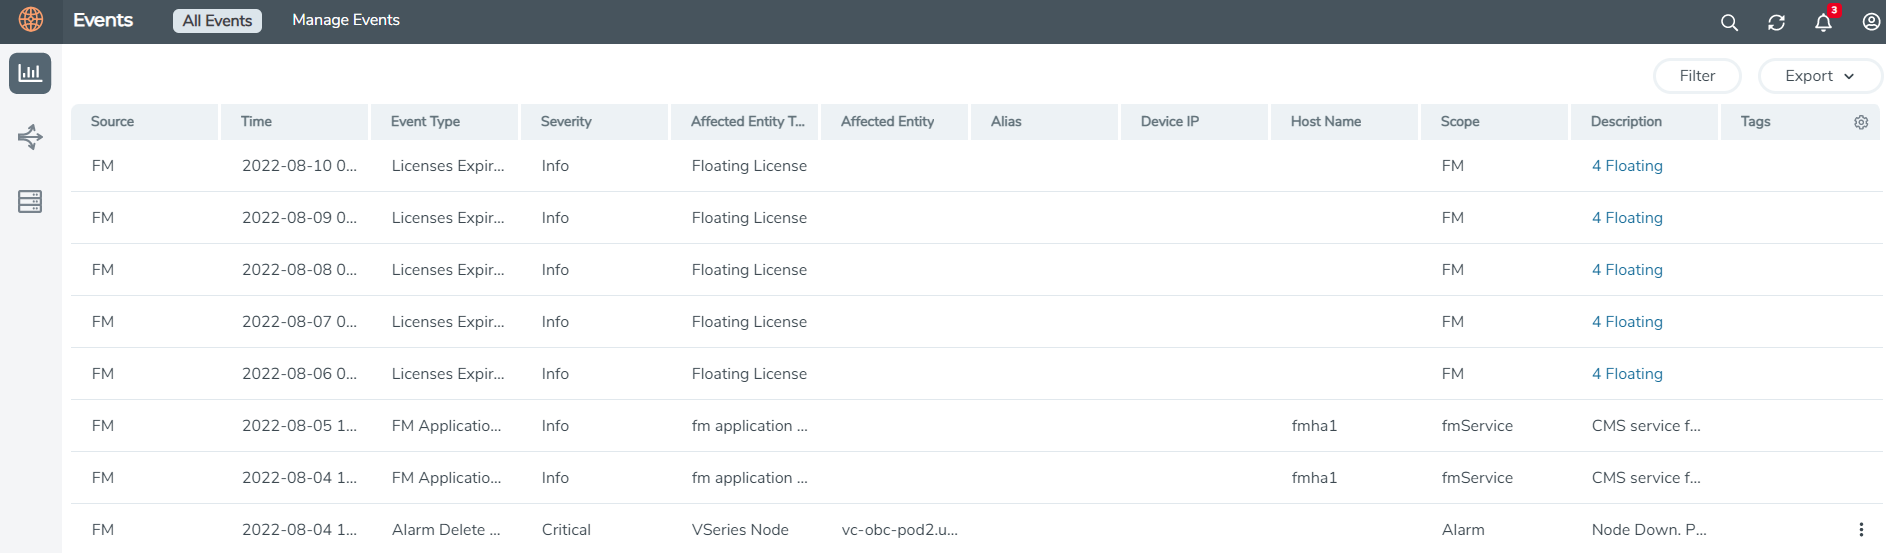
The following table describes the parameters recording for each alarm or event. You can also use filters to narrow down the results.
|
Controls/ Parameters |
Description |
|||||||||
|
Source |
The source from where the events are generated. The criteria are:
|
|||||||||
|
Duration |
The timestamp when the event occurred or the duration of the event. IMPORTANT: Timestamps or the duration appear in the time zone of the client browser’s computer and not the time zone of the node reporting the event. The timestamp is based on the correctly configured clock on the GigaVUE-FM server and converted from UTC to the client computer’s configured time zone. |
|||||||||
|
Scope |
The category to which the events belong. Events can belong to the following categories: Domain, Node, Card, Port, Stack, Cluster, Chassis, GigaVUE-FM, GigaVUE-VM, and so on. For example, if an event generates a notification for port utilization low threshold, the scope is displayed as Physical Node. |
|||||||||
|
Alarm Type |
The type of events that generates the alarms. The types of alarms are Abnormal Fan Operation, Card Unhealthy, Circuit Tunnel Unhealthy, CPU Over Loaded, Device Upgrade Failed. |
|||||||||
|
Event Severity |
The severity is one of Critical, Major, Minor, Warning, or Info. Info is informational messages. For example, when a power status change notification is displayed, the message is Info. |
|||||||||
|
Event Status |
The status of the event. The status is either Acknowledged or Unacknowledged. |
|||||||||
|
Event Type |
The type of event that generated the events. The types of events are CPU utilization high, cluster updated, device discovery failed, fan tray changed, netflow generation statistics, and so on. |
|||||||||
|
Affected Entity Type |
The resource type associated with the event. For example, when a low disk space notification is generated, 'Chassis' is displayed as the affected entity type. |
|||||||||
|
Cluster ID |
Enter the Cluster ID. |
|||||||||
|
Affected Entity |
The resource ID of the affected entity type. For example, when low disk space notification is generated, the IP address of the node with the low disk space is displayed as the affected entity. |
|||||||||
|
Device IP |
The IP address of the device. |
|||||||||
|
Host Name |
The host name of the device. |
|||||||||
|
Alias |
Event Alias |
|||||||||
|
Monitoring Domain |
The name of the Monitoring Domain. |
|||||||||
|
Connection |
The name of the Connection. |
|||||||||
|
Show Non-taggable Entities |
Enable to display the events for entities that you cannot tag. For example, Policies, GigaVUE‑FM instance, and other such entities. |
|||||||||
|
Tags |
Select the Key and the Value from the drop-down list. |
To filter the alarms and events,
-
Select Filter.
The Filter quick view is displayed.
-
Select the filtering criteria, and then select Apply Filter.
The result appears on the Events page.


