Cloud Overview Page (OpenStack)
The Overview page lets you view and manage all Monitoring Sessions in one place. You can quickly find issues to help with troubleshooting or take simple actions like viewing, editing, cloning, or deleting sessions.
This page shows key information at a glance, including:
-
Basic statistics
-
V Series alarms
-
Connection status
-
Volume usage vs. allowance
-
A summary table of active monitoring sessions
You can edit a Monitoring Session directly from this page without switching to each platform’s session page.
How to Access the Overview Page
You can access the overall Cloud overview or the platform-specific Cloud overview.
Perform one of the following:
-
Go to Traffic > Virtual > Overview for the overall cloud overview page.
-
For the Platform-specific cloud overview details:
-
Go to Traffic > Virtual > Overview.
-
On the top-left menu from the Platform drop-down option, select the name of your cloud.
-
The Monitoring Sessions page appears.
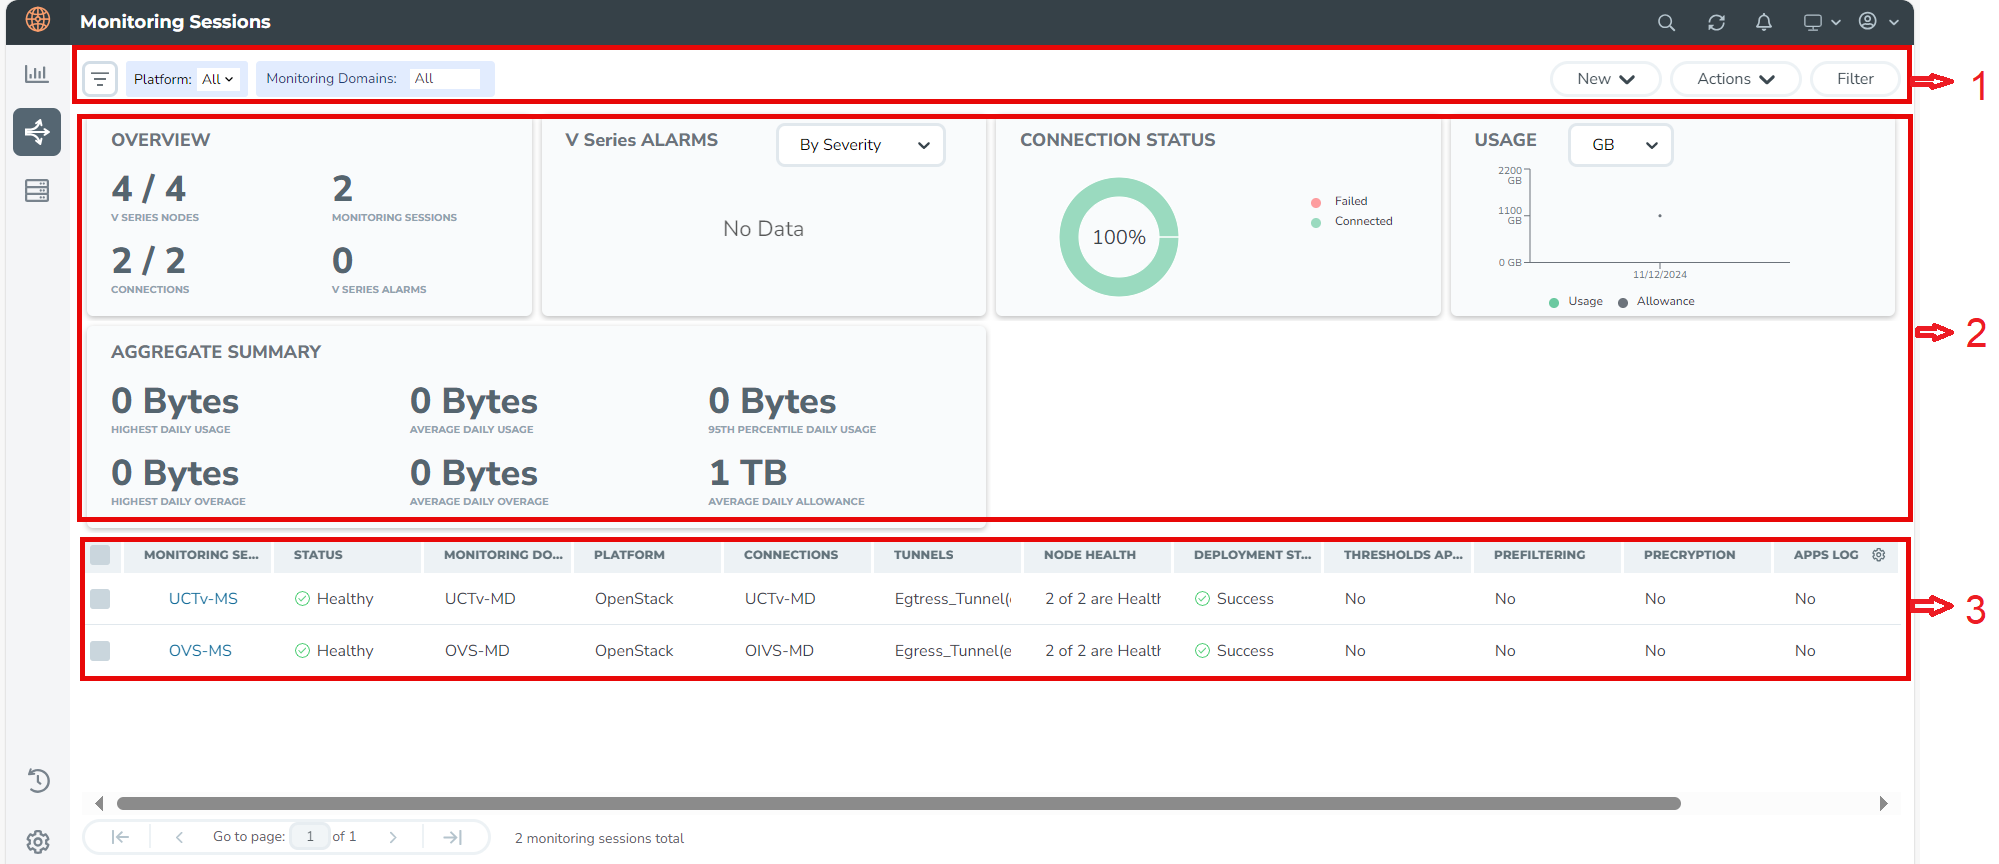
Page Layout for Easy Use
The page is split into three main sections for easier navigation, as displayed in the screenshot and explained in the following table:
| Number |
Section |
Description |
|---|---|---|
|
1 |
Top Menu |
Refer to Top Menu. |
|
2 |
Charts |
Refer to Viewing Charts on the Overview Page. |
|
3 |
Monitoring Session Details |
On the Overview page, you can view the Monitoring Session details of all the cloud platforms. For details, refer to the Viewing Monitoring Session Details section. |
Top Menu
The Top menu consists of the following options:
|
Options |
Description |
|
New |
Allows to create a new Monitoring Session and new Monitoring Domain. |
|
Actions |
Allows the following actions:
|
|
Filter |
You can filter the Monitoring Session details based on a criterion or a combination of criteria. For more information, refer to Filters. |
Filters
On the Monitoring Sessions page, you can apply the filters using the following options:
Filter on the left corner
-
1. From the Platform drop-down list, select the required platform. -
1. Select and select the Monitoring Domain.
You can select one or multiple domains. You can also edit and create a new Monitoring Domain in the filter section.
Filter on the right corner
Use this filter to narrow down results with one or more of the following:
-
Monitoring Session
-
Status -
Monitoring Domain -
Platform -
Connections -
Tunnel -
Deployment Status
Viewing Charts on the Overview Page
You can view the following charts on the overview page:
- Overview
- V Series Alarms
- Connection Status
- Usage
- Aggregate Summary
Overview
This chart shows:
-
The number of active GigaVUE V Series Nodes.
-
The number of configured Monitoring Sessions and connections.
-
The number of V Series alarms triggered.
V Series Alarms
This widget uses a pie chart to display V Series alarms.
-
Each alarm type has its own color that is visible in the legend.
-
Hover over a section to see the total number of alarms triggered.
Connection Status
This pie chart shows the status of connections in a Monitoring Domain.
-
Successful and failed connections are marked in different colors.
-
Hover over a section to view the total number of connections.
Usage
The Usage chart shows daily traffic volume through the V Series Nodes.
-
Each bar represents one day’s usage.
-
Hovering over a bar helps you see the volume used and the limit for that day.
Aggregate Summary
This summary shows key volume usage stats:
-
Highest daily volume usage
-
Average daily volume usage
-
Highest daily over-usage
-
Average daily over-usage
-
95th percentile daily usage
-
Average daily volume allowance
Viewing Monitoring Session Details
The overview table shows key details about each monitoring session. You can use this table to check session health, view settings, or take actions quickly.
| Details | Description |
|
Monitoring Sessions |
Displays the name of each session. Select a name to open the Monitoring Session’s page in the selected cloud platform. |
|
Status |
Displays the Health status of the Monitoring Session. |
|
Monitoring Domain |
Displays the name of the Monitoring Domain to which the Monitoring Session is associated. |
|
Platform |
Indicates the Cloud platform in which the session is created. |
|
Connections |
Displays Connection details of the Monitoring Session. |
|
Tunnels |
Lists the Tunnel details related to the Monitoring Session. |
|
Node Health |
Displays the Health status of the GigaVUE V Series Node. |
|
Deployment Status |
Displays the status of the deployment. |
|
Threshold Applied |
Specifies if the threshold is applied. |
|
Prefiltering |
Specifies if Prefiltering is configured. |
|
Precryption |
Specifies if Precryption is configured. |
|
APPS logging |
Specifies if APPS logging is configured. |
|
Traffic Mirroring |
Specifies if Traffic Mirroring is configured. |
Note: Select the settings icon  and customize the options visible in the table.


