Visualize the Network Topology (OpenStack)
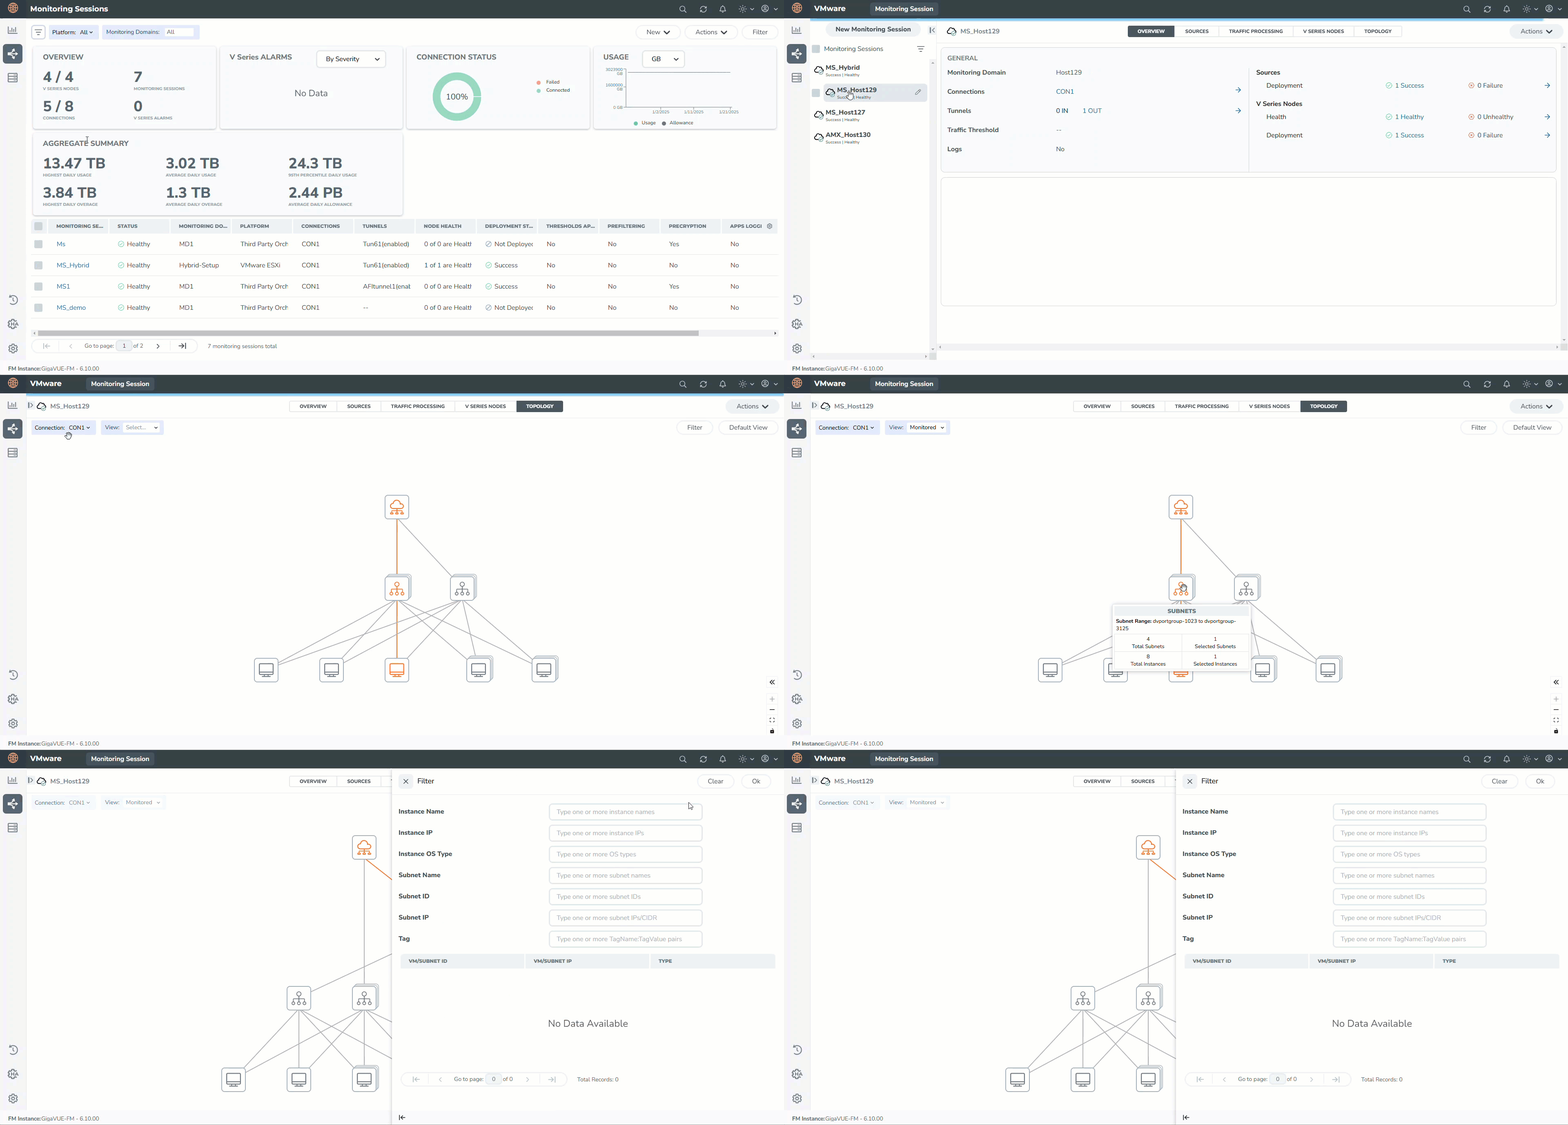
You can have multiple connections in GigaVUE‑FM. Each connection can have multiple Monitoring Sessions configured within them. You can select the connection and the Monitoring Session to view the selected subnets and instances in the topology view.
To view the topology in GigaVUE‑FM:
- Go to Traffic > Virtual > Orchestrated Flows and select your cloud platform. The Monitoring Sessions landing page appears.
- After creating a new Monitoring Session or on an existing Monitoring Session, navigate to the TOPOLOGY tab. The Topology page appears.
-
Select a connection from the Connection list. The topology view of the monitored subnets and instances in the selected session are displayed.
-
Select the instance type from View. The available instance types are Fabric and Monitored.

- (Optional) Hover over the subnet or VM group icons to view details such as the subnet ID, subnet range, and the total number of subnets and instances. Click the subnet or VM group icons to explore the subnets or instances within the group.
In the Topology page, you can also do the following:
- Use the Filter button to filter the instances based on the VM name, VM IP, OS Type, Subnet ID, or Subnet IP, and view the topology based on the search results.
- Use the Default View button to view the topology diagram based on the source interfaces of the monitored instances.
- Use + or - icons to zoom in and zoom out the topology view.
- Click the Fit View icon to fit the topology diagram according to the width of the page.


