Create Raw Endpoint (VMware NSX-T)
This section provides step-by-step instructions on configuring a RAW Endpoint (REP) in the Monitoring Session.
Refer to the below sections for more detailed information:
- Rules and Notes
- Create Raw Endpoint (VMware NSX-T)
- Configure Raw Endpoint in Monitoring Session
- Configuration Support for Non IP-Addressable (l2 supported) Tools
Rules and Notes
- When using VMware NSX-T, Monitoring session supports only egress RAW Endpoint.
- REP is not supported on NSX Segments, you can use Virtual Standard Switch (VSS) port group to configure REPs.
- GigaVUE-FM expects the IP address to be configured on the GigaVUE V Series Node interface which will be used for creating RAW Endpoint (REP).
-
The maximum number of links that can egress from any endpoint in V Series is four.
Points to Note:
Refer to the following table for more detailed information on the number of interfaces, their roles for the GigaVUE V Series Nodes deployed in the Monitoring Domain.
| Display Name | Interface Name | Role | Comments |
|---|---|---|---|
|
Network Adapter 1 |
ens160 |
Management |
- |
|
Network Adapter 2 |
ens192 |
Tunnel |
Supports Tunnel and Egress RAW endpoint. |
|
Network Adapter 3 |
ens224 |
Data |
Reserved and used by NSX-T for Service Insertion (Traffic Acquisition) |
Configure Raw Endpoint in Monitoring Session
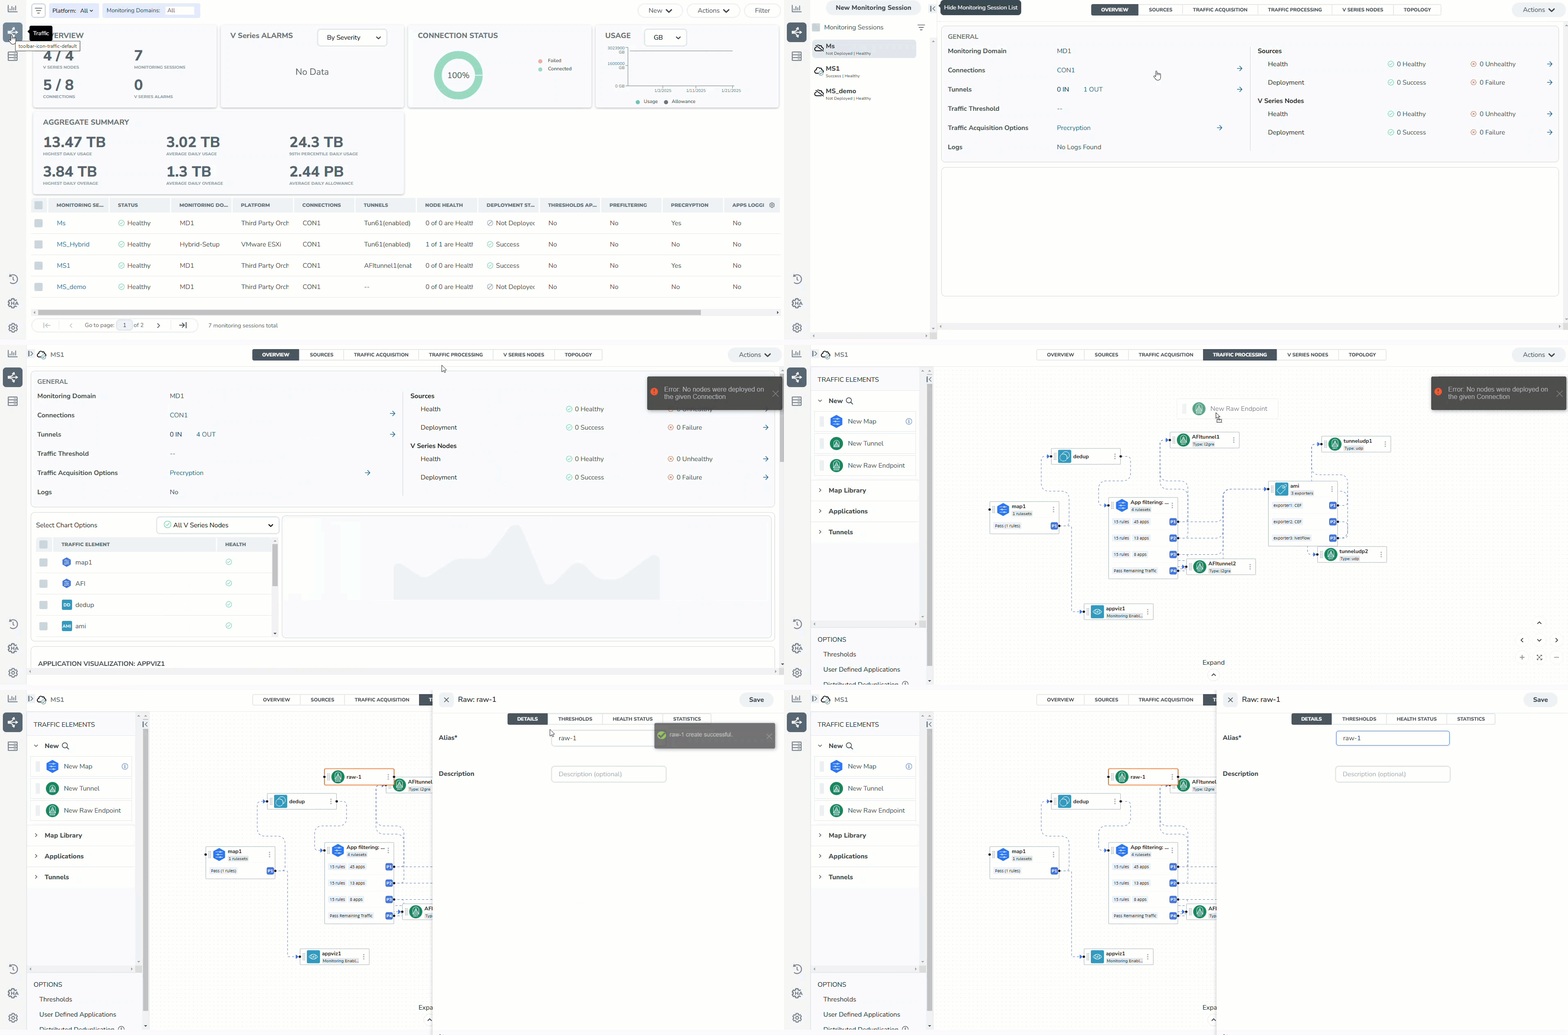
Raw End Point (REP) is used to pass traffic from an interface. REP is used to ingress data from a physical interface attached to GigaVUE V Series Nodes. You can optionally use this end point to send traffic to the applications deployed in the monitoring session.
To add Raw Endpoint to the Monitoring Session:
- Drag and drop New Raw Endpoint from the New expand menu to the graphical workspace.
- On the new raw endpoint icon, click the
 menu button and select Details. The Raw quick view page appears.
 - Enter the Alias and Description details for the Raw End Point and click Save.

- To deploy the Monitoring Session after adding the Raw Endpoint:
- Click Deploy from the Actions drop-down list on the TRAFFIC PROCESSING page. The Deploy Monitoring Session dialog box appears.
- Select the V Series Nodes for which you wish to deploy the Monitoring Session.
- Select the interfaces for each of the REPs and the TEPs deployed in the Monitoring Session from the drop-down menu for the selected individual V Series Nodes. Click Deploy.
- Click Export to download all or selected V Series Nodes in CSV and XLSX formats.
Configuration Support for Non IP-Addressable (l2 supported) Tools
Follow the steps given below to deliver RAW traffic to tools or sensors that do not have IP address support:
- Create a Virtual Standard Switch (VSS) with the details given below. No uplink is required (and hence no physical NIC is required).
- Create two port groups on the vSwitch created in the previous step:
- Create a port group (For example, EgressPortgroup for GigaVUE V Series Node to egress RAW packets)
- Create a port group (IngressPortgroup) with promiscuous mode enabled for mirroring the packets.
Note: Refer to Port Group Configuration for Virtual Machines section in the VMware Documentation for more detailed information on how to create a VSS and how to configure the port groups.
- Connect the tool or sensor interface to IngressPortgroup.
NOTE:
- The sensor or tool should be deployed on the same host where the GigaVUE V Series Node is deployed.
- The GigaVUE V Series Node should be deployed using Host Based Deployment. Refer to Deploy GigaVUE V Series Nodes using GigaVUE-FM for more detailed information on how to deploy GigaVUE V Series Node using Host Based deployment type.
- Deploy GigaVUE V Series Node on the ESXi host where the tool or sensor is deployed.
- Select EgressPortgroup for the GigaVUE V Series Node Tunnel Interface (Network Adapter 2 or ens192) while deploying the GigaVUE V Series Node.
- Deploy Monitoring Session with RAW Endpoint for egress and then select ens192 as the interface during interface mapping step as in the Configure Raw Endpoint in Monitoring Session.
Note: Promiscuous mode Port Group will mirror the entire switch traffic


