Add Applications to Monitoring Session
GigaVUE Cloud Suite with GigaVUE V Series 2 node supports the following GigaSMART applications in the GigaVUE-FM canvas:
You can also configure the following GigaSMART operations from the Traffic > Solutions > Application Intelligence:
| Application Metadata Intelligence |
| Application Filtering Intelligence |
For the detailed list of GigaSMART Operation supported for V Series 2 nodes, refer to Supported GigaSMART Operations.
You can optionally use these applications to optimize the traffic sent from your instances to the monitoring tools. Refer to the Base Bundles section for more information on Licenses for using V Series 2 Nodes.
To add a GigaSMART application:
- Drag and drop an application from APPLICATIONS to the canvas.
- In the canvas, click the application and select Details.
- Enter or select the required values for the selected application and click Save.
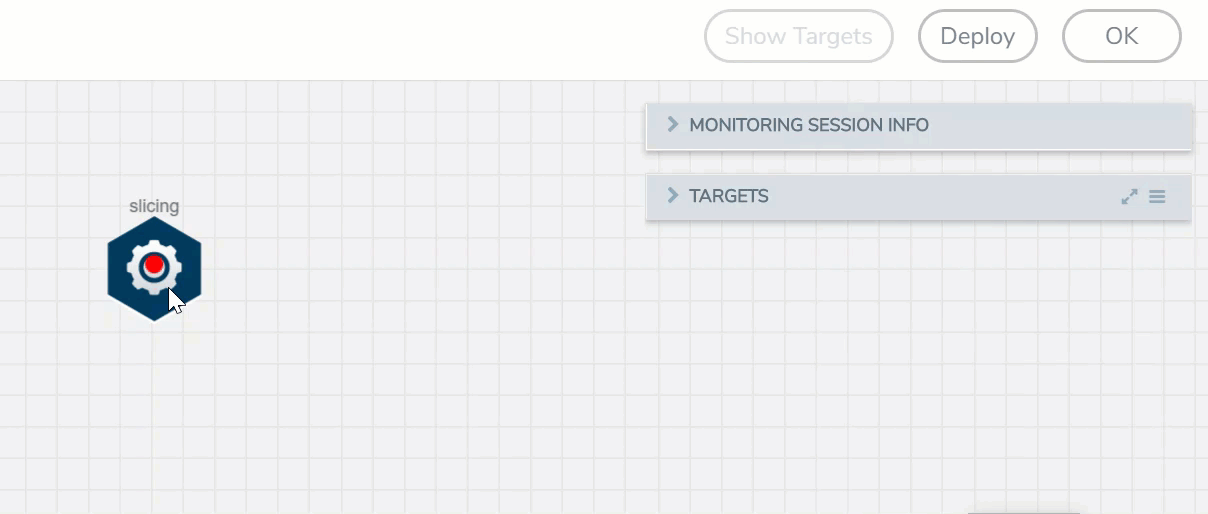
Slicing
Packet slicing lets you truncate packets after a specified header and slice length, preserving the portion of the packet required for monitoring purposes. For detailed information on Slicing, refer to GigaSMART Packet Slicing.
To add a slicing application:
- Drag and drop Slicing from APPLICATIONS to the graphical workspace.
- Click the Slicing application and select Details. The Application quick view appears.
- In the Application quick view, enter the information as follows:
- In the Alias field, enter a name for the slicing.
- From the Protocol drop-down list, specify an optional parameter for slicing the specified length of the protocol.
- In the Offset field, specify the length of the packet that must be sliced.
- In the Enhanced Name field, enter the Enhanced Slicing profile name.
- Click Save.
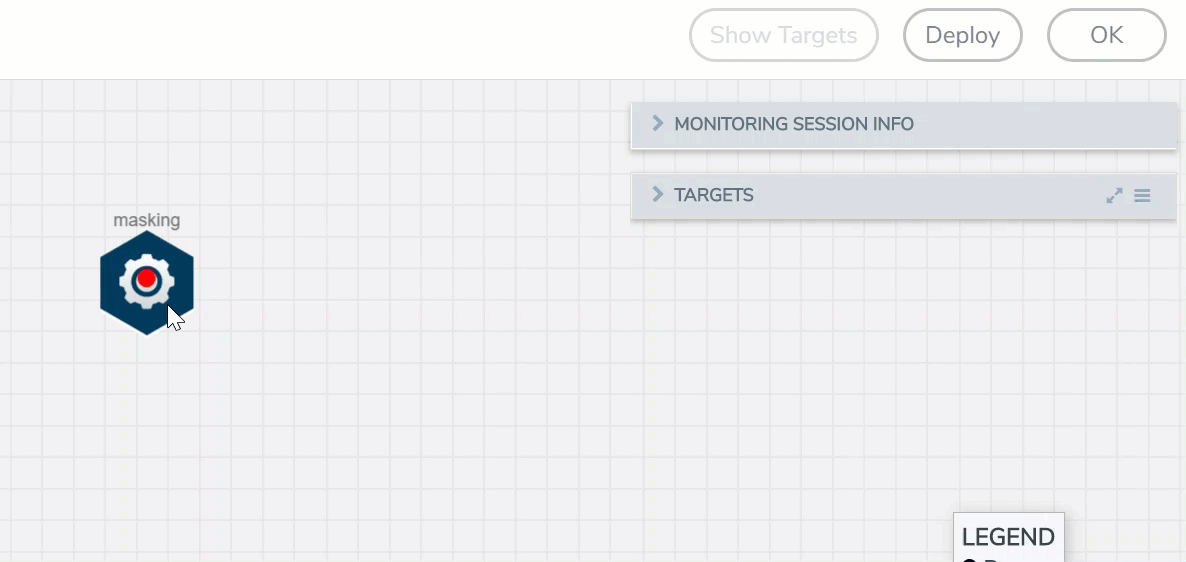
Masking
Masking lets you overwrite specific packet fields with a specified pattern so that sensitive information is protected during network analysis. For detailed information on masking, refer to GigaSMART Masking.
To add a masking application:
- Drag and drop Masking from APPLICATIONS to the graphical workspace.
- Click the Masking application and select Details. The Application quick view appears.
- In the Application quick view, enter the information as follows:
- In the Alias field, enter a name for the masking.
- From the Protocol drop-down list, specify an optional parameter for masking the specified length of the protocol.
- In the Offset field, specify the length of the packet that must be masked.
- In the Pattern field, enter the pattern for masking the packet.
- In the Length field, enter the length of the packet that must be masked.
- Click Save.
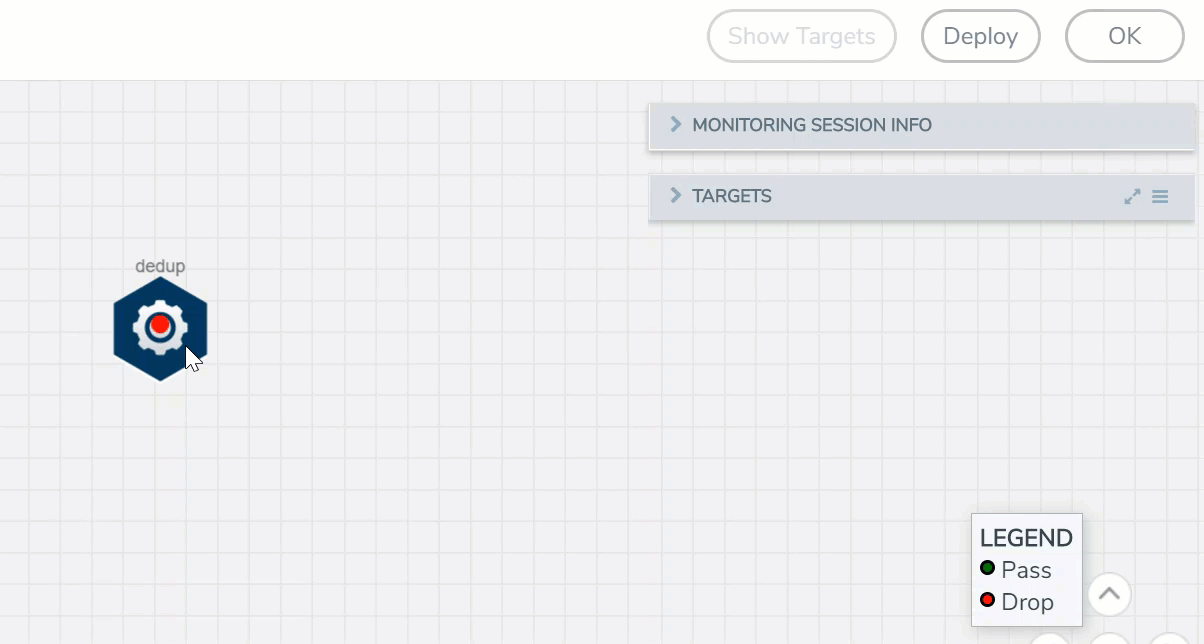
Dedup
De-duplication lets you detect and choose the duplicate packets to count or drop in a network analysis environment. For detailed information on de-duplication, refer to GigaSMART De-Duplication.
To add a de-duplication application:
- Drag and drop Dedup from APPLICATIONS to the graphical workspace.
- Click the Dedup application and select Details. The Application quick view appears.
- In the Application quick view, enter the information as follows:
- In the Alias field, enter a name for the de-duplication.
- In the Action field, select Count or Drop the detected duplicate packets.
- For IP Tclass, IP TOS, TCP Sequence, and VLAN fields, select Include or Exclude the packets for de-duplication.
- In the Timer field, enter the time interval (in seconds) for de-duplicating the packet.
- Click Save.
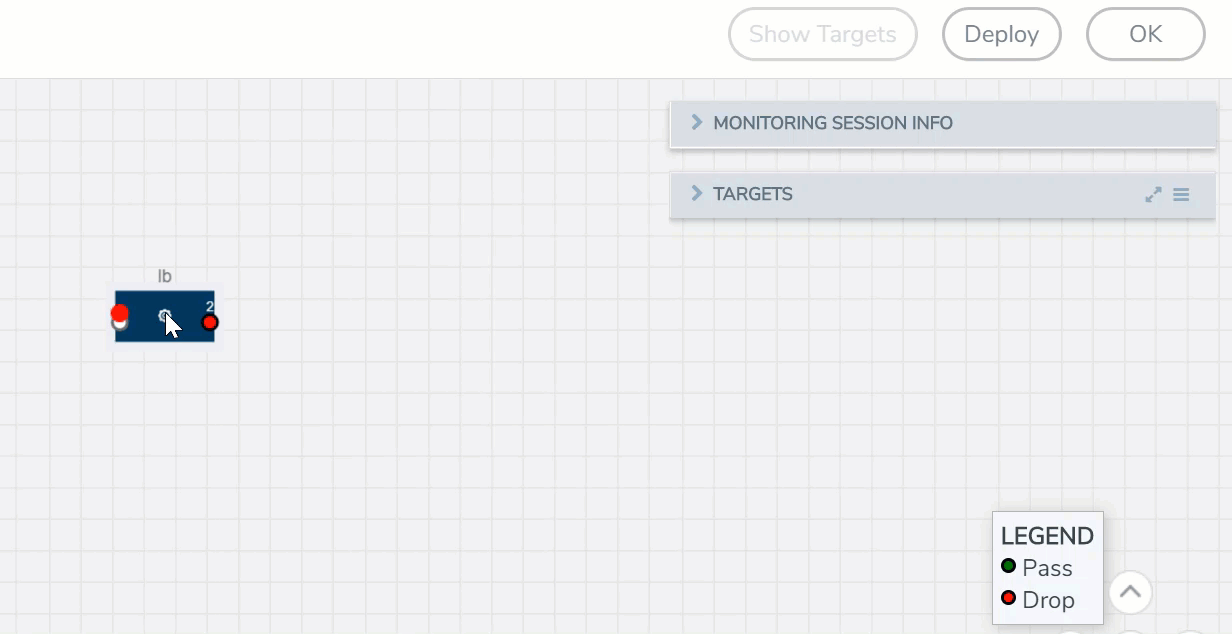
Load Balancing
Load balancing application performs stateless distribution of the packets between different endpoints. For detailed information on load balancing, refer to GigaSMART Load Balancing.
To add a load balancing application:
- Drag and drop Load Balancing from APPLICATIONS to the graphical workspace.
- Click the load balancing application and select Details. The Application quick view appears.
- In the Application quick view, enter the information as follows:
- In the Alias field, enter a name for the load balancing app.
- For Hash Fields field, select a hash field from the list.
- ipOnly—includes Source IP, and Destination IP.
- ipAndPort—includes Source IP, Destination IP, Source Port , and Destination Ports.
- fiveTuple—includes Source IP, Destination IP, Source Port, Destination Port, and Protocol fields.
- gtpuTeid—includes GTP-U.
- For Field location field, select Inner or Outer location.
Note: Field location is not supported for gtpuTeid.
- In the load balancing groups, add or remove an application with the Endpoint ID and Weight value (1-100). A load balancing group can have minimum of two endpoints.
- Click Save.
PCAPng
The PCAPng application is a GigaSMART parser application that reads the various blocks in the received PCAPng files and validates the blocks to be sent to the destination application or to the tools.
Note: The PCAPng application is only applicable for the Ericsson 5G Core vTAP architecture. Refer to PCAPng Application for detailed information.
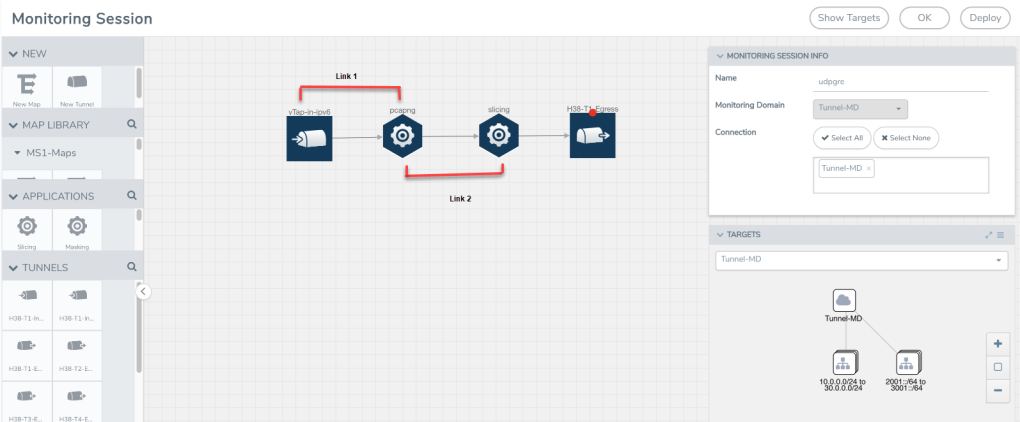
Create Link Between UDP-in-GRE Tunnel and PCAPng Application
To create a link with source as UDP-in-GRE tunnel and destination as PCAPng application:
- In the GigaVUE‑FM canvas, select New > New Tunnel, drag and drop a new tunnel template to the workspace. The Add Tunnel Spec quick view appears.
- On the New Tunnel quick view, enter or select the required information as described in the following table.
Field
Description
Alias
The name of the tunnel endpoint
Note: Do not enter spaces in the alias name.
Description
The description of the tunnel endpoint
Type
Select UDPGRE as the tunnel type
Traffic Direction
The direction of the traffic flowing through the V Series node
- Choose In (Decapsulation) for creating an Ingress tunnel, traffic from the source to the V Series node
IP Version
The version of the Internet Protocol. Select IPv4 or IPv6
Remote Tunnel IP
The IP address of the tunnel source
Key
GRE key value
Source L4 Port
Layer 4 source port number
Destination L4 Port
Layer 4 destination port number. You can configure only 4754 or 4755 as the destination UDP ports
- Click Save.
- Click and drag the PCAPng application into the canvas. Configure the alias for the application.
- Establish a link between the UDP-GRE TEP configured above and the PCAPng application.
Create Link Between PCAPng Application and Other Destinations
Create a link with source as PCAPng application and destination as one of the following:
- Other GigaSMART applications such as Slicing, Masking, etc.
- Other encapsulation TEPs.
- REP/MAP
Refer to the following image for a sample configuration.
GENEVE De-encapsulation
The GENEVE De-encapsulation application is used to acquire and strip GENEVE headers. To route the traffic through the third-party network appliances seamlessly, the AWS gateway load balancer with a VPC adds GENEVE header to packets as they are forwarded to a third-party network appliance. Each appliance is expected to terminate the GENEVE tunnel and process the GENEVE encapsulated traffic traffic. When the GigaVUE-FM directs the acquisition of the customer traffic, the packets are encapsulated and forwarded as GENEVE tunnels that are terminated in GigaVUE V Series nodes.
To add a GENEVE application:
- Drag and drop GENEVE from APPLICATIONS to the graphical workspace.
- Click the GENEVE application and select Details. The Application quick view appears.
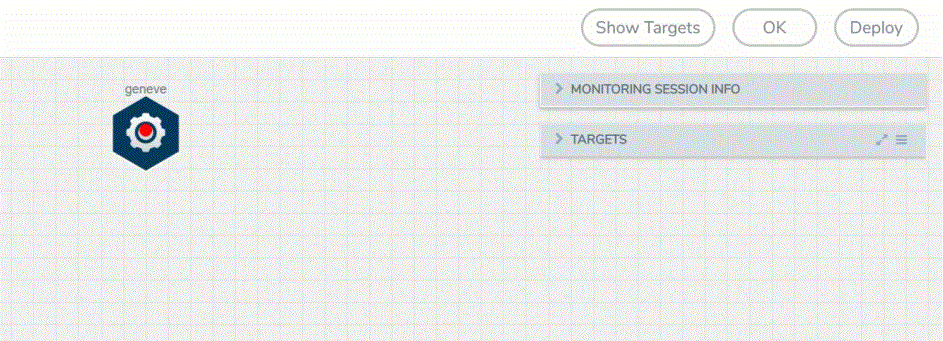
- Enter an alias for the GENEVE application.
- Click Save.
Application Metadata Exporter
Rules and Prerequisites:
Prerequisites to follow when creating a monitoring domain and deploying a V Series node:
- Select Traffic Acquisition Method as None. Refer Create a Monitoring Domain for more detailed information on how to create a monitoring domain.
- Select Instance type with three or more NICs. Refer Configure and Deploy GigaVUE Fabric Components in GigaVUE-FM for more detailed information on how to deploy a GigaVUE V Series Node.
- When the Traffic Acquisition Method is selected as None, the Volume Size field appears on the AWS Fabric Launch Configuration page. Enter the Volume Size as 80GB.
Note: Check on the disk space run every 30 minutes and when the disk space reaches 50%, purge starts.
- After deploying the GigaVUE V Series Node in the monitoring domain, click on the GigaVUE V Series Node's Name, and the V Series Node quick view opens. Choose a data IP to which you wish to send CEF packets, then use the IP address of this data IP as the Tool IP Address when creating the Application Metadata Intelligence solution. Refer
to Create Metadata Intelligence by Editing Monitoring Session from Dashboard
topic in the GigaVUE Fabric Management Guide on how to configure AMI for
- The GigaVUE V Series Node deployed must be entirely dedicated to the
Rules to follow when using the
- The monitoring session can only have Raw End Point (REP), it cannot have other applications, maps, or tunnels when using the
To add
- Drag and drop
- Enter the Alias for the application.
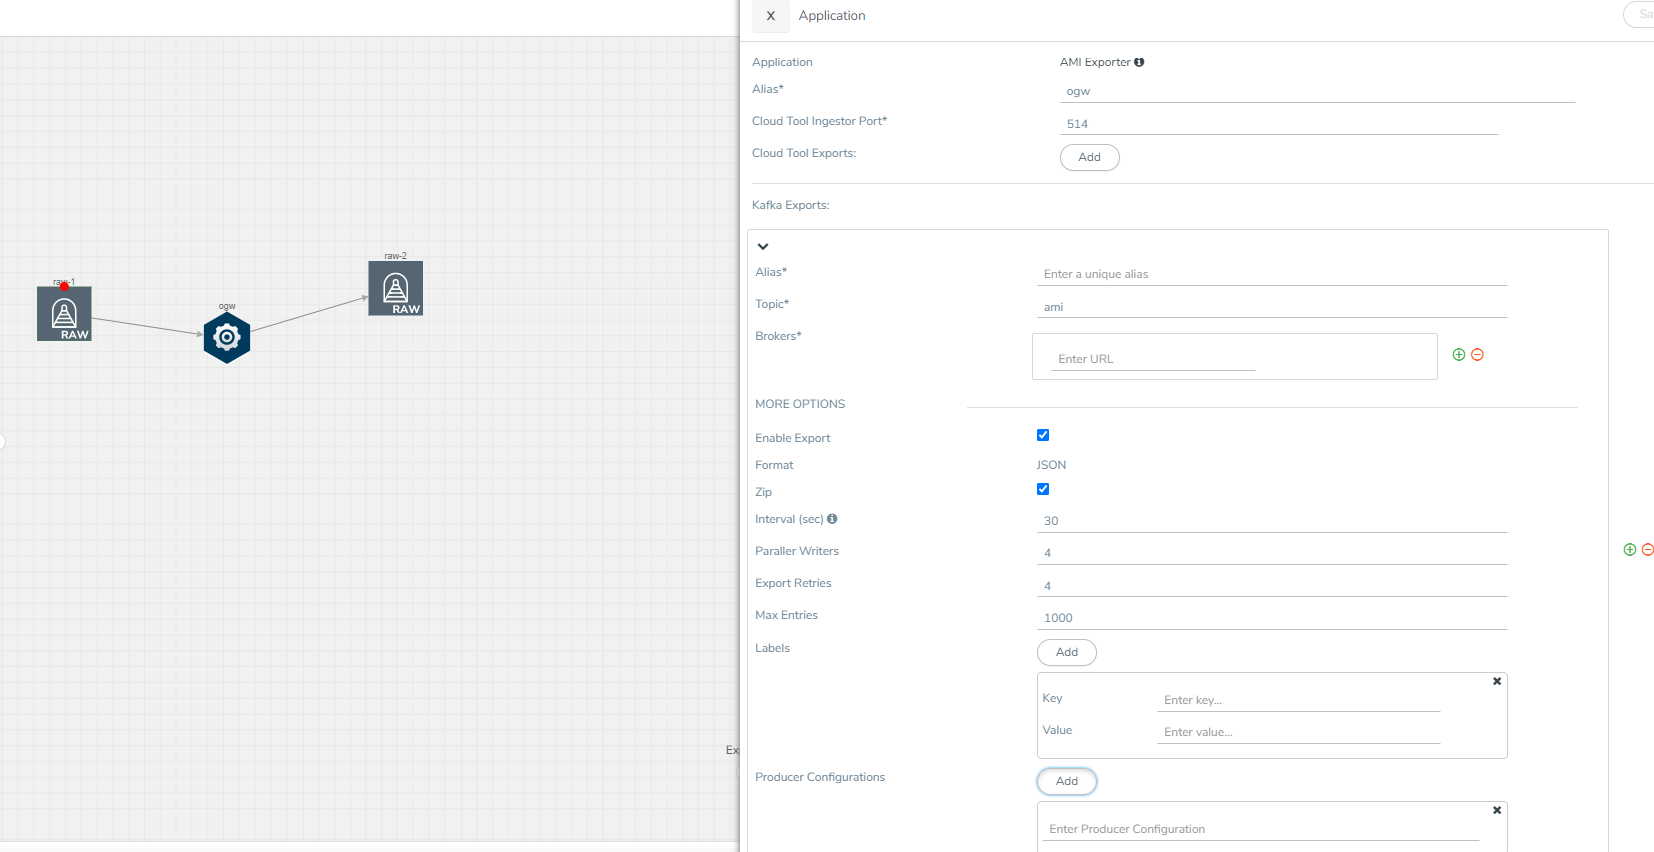
-
Fields
Description
Alias
Enter the alias name for the cloud tool export.
Cloud Tool
Select the Cloud tool from the drop-down menu.
Account ID
Enter the account ID number of the selected Cloud Tool.
API Key
Enter the API key of the Cloud Tool.
Enable Export
Enable the box to export the Application Metadata Intelligence output in JSON format.
Zip
Enable the box to compress the output file.
Note: Enable this field when using New Relic as the cloud tool.
Interval
The time interval (in seconds) in which the data should be uploaded periodically. The recommended minimum time interval is 10 seconds and the maximum time interval is 30 minutes.
Parallel Writer
Specifies the number of simultaneous JSON exports done.
Export Retries
The number of times the application tries to export the entries to Cloud Tool. The recommended minimum value is 4 and the maximum is 10.
Maximum Entries
The number of JSON entries in a file. The maximum number of allowed entries is 5000 and the minimum is 10, however 1000 is the default value.
Labels
Click Add. Enter the following details:
o Enter the Key . o Enter the Value. Note: When New Relic is selected as the cloud tool, ensure that the key is eventType and the Value can only have alphanumeric characters, colons ( : ), periods ( . ), and underscores ( _ ).
Enter the following details for Kafka export in the Application quick view:
Fields
Description
Alias
Enter the alias name for the Kafka Export.
Topic
The topic name to push JSON streams to, which is generally given to users part of the Kafka administration Brokers
The URL that contains the Kafka cluster endpoints. Click  to add another broker and click
  to remove an existing broker.
Enable Export
Enable the box to export the Application Metadata Intelligence output in JSON format.
Zip
Enable the box to compress the output file.
Interval
The time interval (in seconds) in which the data should be uploaded periodically. The recommended minimum time interval is 10 seconds and the maximum time interval is 30 minutes.
Parallel Writer
Specifies the number of simultaneous JSON exports done.
Export Retries
The number of times the application tries to export the entries to Kafka. The recommended minimum value is 4 and the maximum is 10.
Maximum Entries
The number of JSON entries in a file. The maximum number of allowed entries is 5000 and the minimum is 10, however 1000 is the default value.
Labels
Click Add. Enter the following details:
o Enter the Key. o Enter the Value. Producer Configurations Click Add to enter the authentication details if a Kafka broker needs authentication.
For Example:
- security.protocol=SASL_SSL
- sasl.mechanism=PLAIN
- sasl.username=username
- sasl.password=password
- Click Deploy to deploy the monitoring session. The Select nodes to deploy the Monitoring Session dialog box appears. Select the GigaVUE V Series Node for which you wish to deploy the monitoring session.
- After selecting the V Series Node, select the interfaces for the REPs deployed in the monitoring session from the drop-down menu. Then, click Deploy.
The monitoring session configuration health can be viewed on the Monitoring Session page. Refer Cloud Health Monitoring - Configuration Health Monitoring for more detailed information on how to view cloud configuration health.
To view the application statistics on the Monitoring Session Statistics page, click View Monitoring Session Diagram and click on the


