Overview of Events
The Events page display the events generated from GigaVUE V Series Nodes or clusters, GigaVUE-VM virtual traffic visibility nodes, and cloud such as AWS that are stored in the GigaVUE-FM database. Refer to the following figure.
You can also manage the records by archiving them or purging them on a regular basis. Refer to Archive or Purge Event Records.
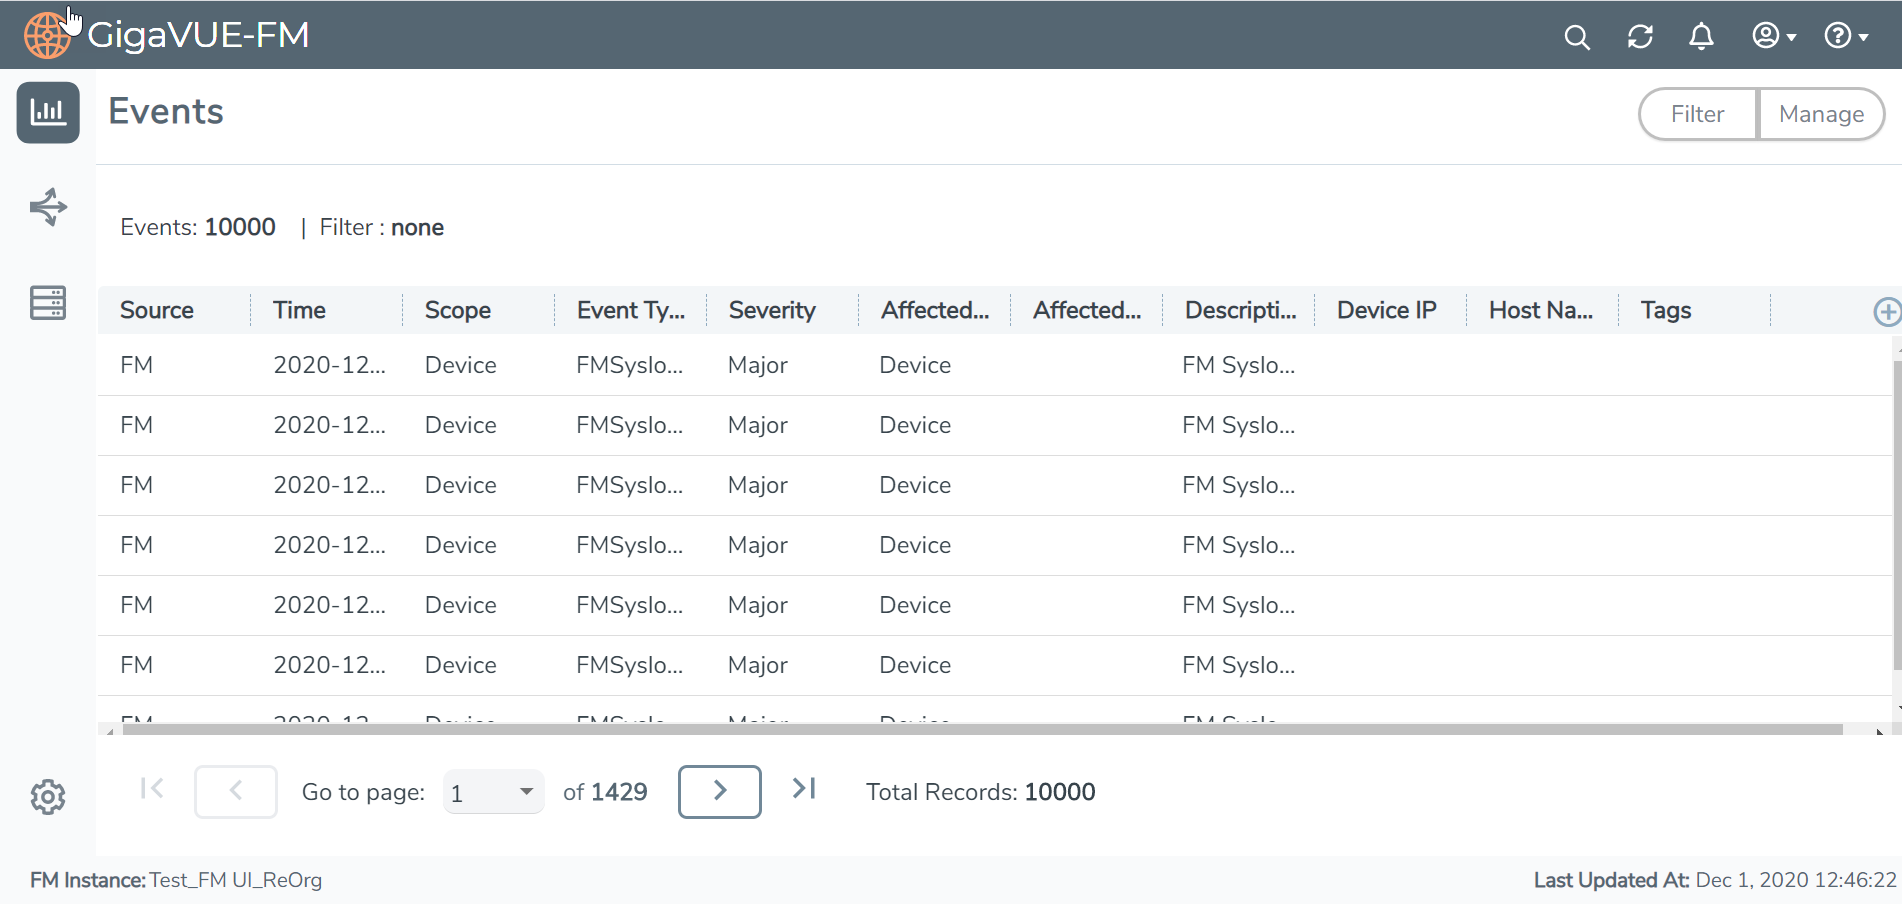
Table 1: Event Parameters describes the parameters recording for each event. You can also use filters to narrow down the results. Refer to Filter Events.
|
Controls/ Parameters |
Description |
||||||||||||
|
Filter |
Opens the Filter quick view for narrowing down the events to view the desired results. |
||||||||||||
|
Manage |
Opens the Manage Event page for exporting and selecting records for archiving or purging. For more information, refer to Filter Events. Note: This option is not available in the Physical and Virtual Events page. |
||||||||||||
|
Source |
The source from where the events are generated. The criteria can be as follows:
|
||||||||||||
|
Time |
The timestamp when the event occurred. IMPORTANT: Timestamps are shown in the time zone of the client browser’s computer and not the time zone of the node reporting the event. The timestamp is based on the correctly configured clock on the GigaVUE-FM server and converted from UTC to the client computer’s configured time zone. |
||||||||||||
|
Event Type |
The type of event that generated the events. The type of events can be CPU utilization high, cluster updated, device discovery failed, fan tray changed, netflow statistics, and so on. |
||||||||||||
|
Severity |
The severity is one of Critical, Major, Minor, or Info. Info is informational messages. For example, when power status change notification is displayed, then the message is displayed as Info. |
||||||||||||
|
Affected Entity Type |
The resource type associated with the event. For example, when low disk space notification is generated, 'Chassis' is displayed as the affected entity type. |
||||||||||||
|
Affected Entity |
The resource ID of the affected entity type. For example, when low disk space notification is generated, the IP address of the node with the low disk space is displayed as the affected entity. |
||||||||||||
| Alias | Event Alias | ||||||||||||
|
Device IP |
The IP address of the device. |
||||||||||||
|
Host Name |
The host name of the device. |
||||||||||||
|
Scope |
The category to which the events belong. Events can belong to the following category: Domain, Node, Card, Port, Stack, Cluster, Chassis, GigaVUE-FM, GigaVUE-VM, and so on. For example, if there is a notification generated for port utilization low threshold, the scope is displayed as Physical Node. |
||||||||||||
|
Tags |
Tags associated with the event |
||||||||||||
|
Description |
The description of the event, which includes any of the possible notifications with additional identifying information where appropriate (such as reporting nodes IP address, username, and so on). |
Note: The columns in the Events page can be customized based on the type of content you want to view in the table. For customizing the columns, refer to the “Table View Customization” section in the GigaVUE Fabric Management Guide.


