Highest Traffic
The Highest Traffic widget can be created for the following:
You can create as many Highest Traffic widgets as you want listing up to 5, 10, 15, 20, 50, or 100 items in each widget.
The highest traffic is measured in megabytes per second (Mbps). You can specify the period over which the amount of traffic must be calculated. The period can be 1 hour, 1 day, 1 week, or 1 month.
|
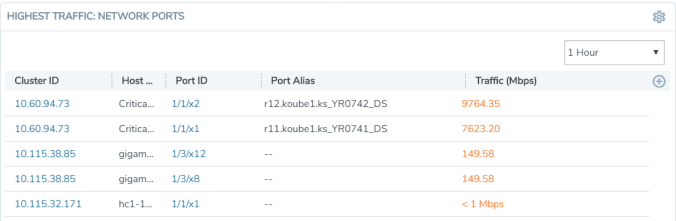
Figure 19
|
Highest Traffic: Example |
The physical maps are listed by the node ID, map alias, and the traffic in Mbps.
The ports are listed by the node on which they are used and the port alias. You can create the Highest Traffic widget for the following ports:
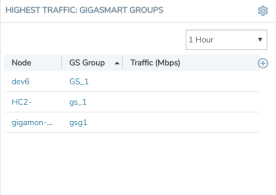
The highest traffic for GigaSMART operations or GigaSMART group can be displayed as shown in Figure 2 Highest Traffic GigaSMART.
|
Figure 20
|
Highest Traffic GigaSMART |
To configure the Highest Traffic widget:
|
1.
|
On the left navigation pane, click on  and from the Physical & Virtual dashboard page, select the profile in which you want to add the widget. and from the Physical & Virtual dashboard page, select the profile in which you want to add the widget. |
|
Figure 22
|
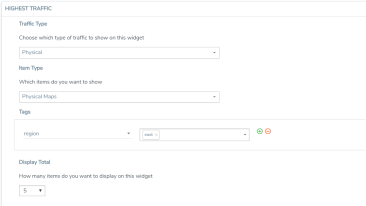
Highest Traffic Configuration |
|
4.
|
From the Traffic Type drop-down list, select one of the following traffic types: |
|
o
|
Physical—Allows you to view the physical maps and ports that contribute to the highest traffic distribution. |
|
o
|
GigaSMART—Allows you to view the virtual ports, GigaSMART groups, and GigaSMART operations that contribute to the highest traffic distribution. |
|
5.
|
From the Item Type drop-down list, select the item you want to view. The options displayed are based on the traffic type you selected in step 5. |
|
6.
|
Select the required tag key and tag value combination (for example: tag key is 'Site' and tag value is 'East') for which the highest traffic distribution must be displayed. This step is optional. |
|
7.
|
From the Display Total drop-down list, select the number of items to be displayed. By default, the number of items selected for display is 5. |


