Visualize the Network Topology
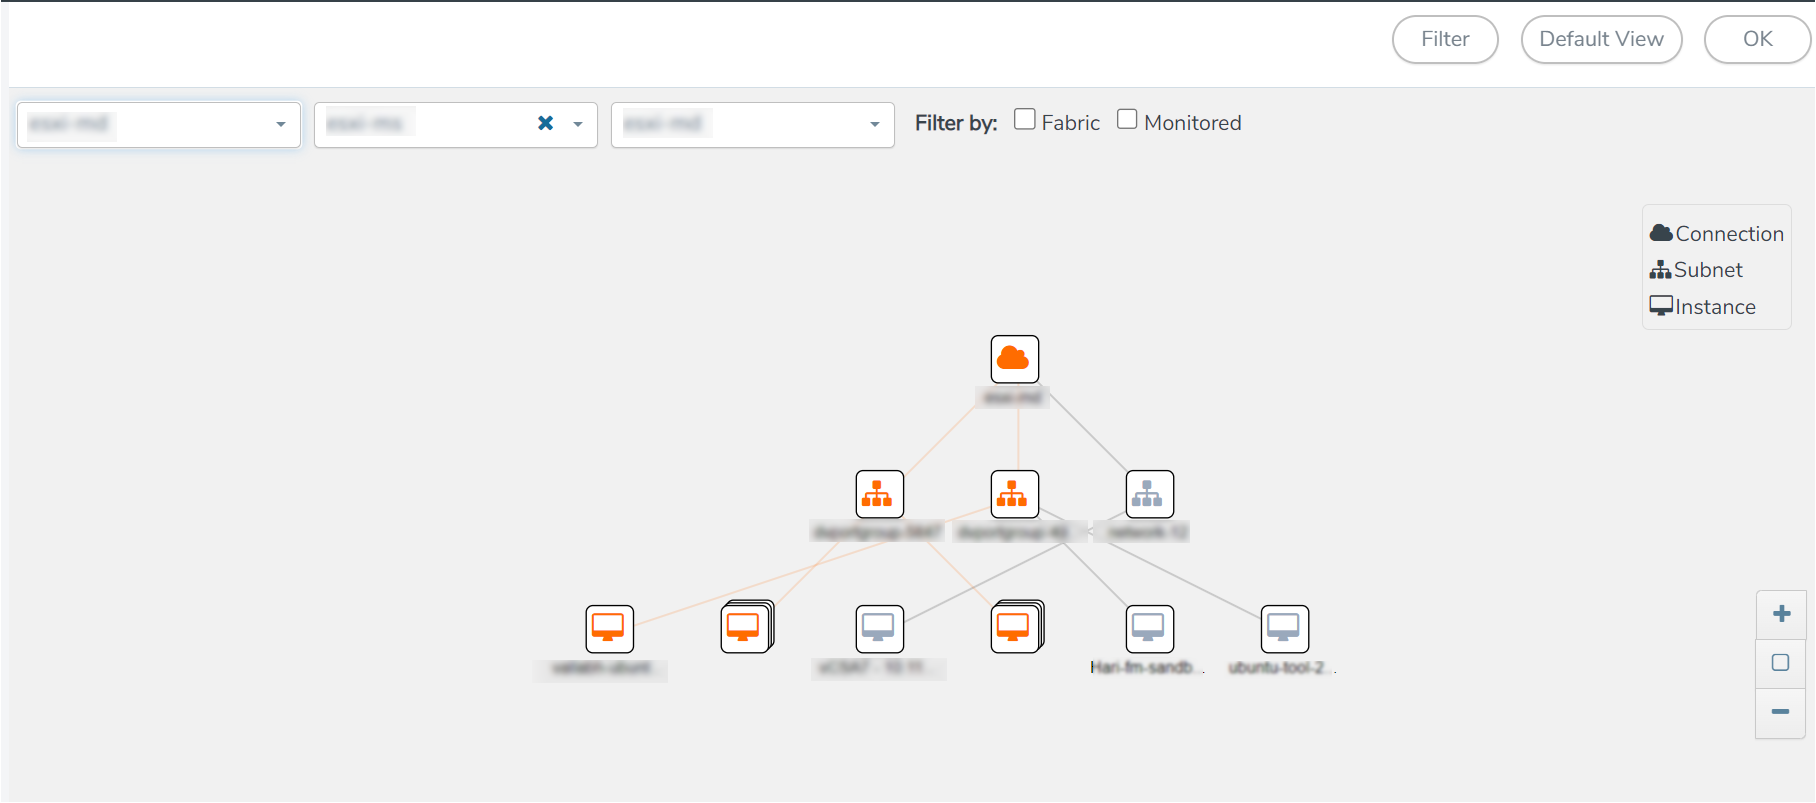
You can have multiple connections in GigaVUE‑FM. Each connection can have multiple Monitoring Sessions configured within it. The Topology tab provides a visual representation of the monitored elements within a selected connection and Monitoring Session.
To view the topology in GigaVUE‑FM:
- Go to Traffic > Virtual > Orchestrated Flows and select your cloud platform.
The Monitoring Sessions landing page appears. - Create a Monitoring Session or select an existing Monitoring Session,
- Open the TOPOLOGY tab.
-
From the Connection list on the Topology page, select a connection.
The topology view of the monitored subnets and instances in the selected session is displayed.
-
From View, select one of the following instance types:
-
Fabric
-
Monitored
-
- (Optional) Hover over or select the subnet or VM Group icons to view the subnets or instances in the group.
On the topology page, you can also do the following:
- Use the Filter button to filter the instances based on the VM name, VM IP, OS Type, Subnet ID, or Subnet IP, and view the topology based on the search results.
- Use the Default View button to view the topology diagram based on the source interfaces of the monitored instances.
- Apply Navigation controls, such as:
Use the arrows at the bottom-right corner to move the topology page up, down, left, or right.
Use + or - icons to zoom in and zoom out of the topology view.
- Select the Fit View icon to fit the topology diagram according to the width of the page.


