View Monitoring Session Statistics (Azure)
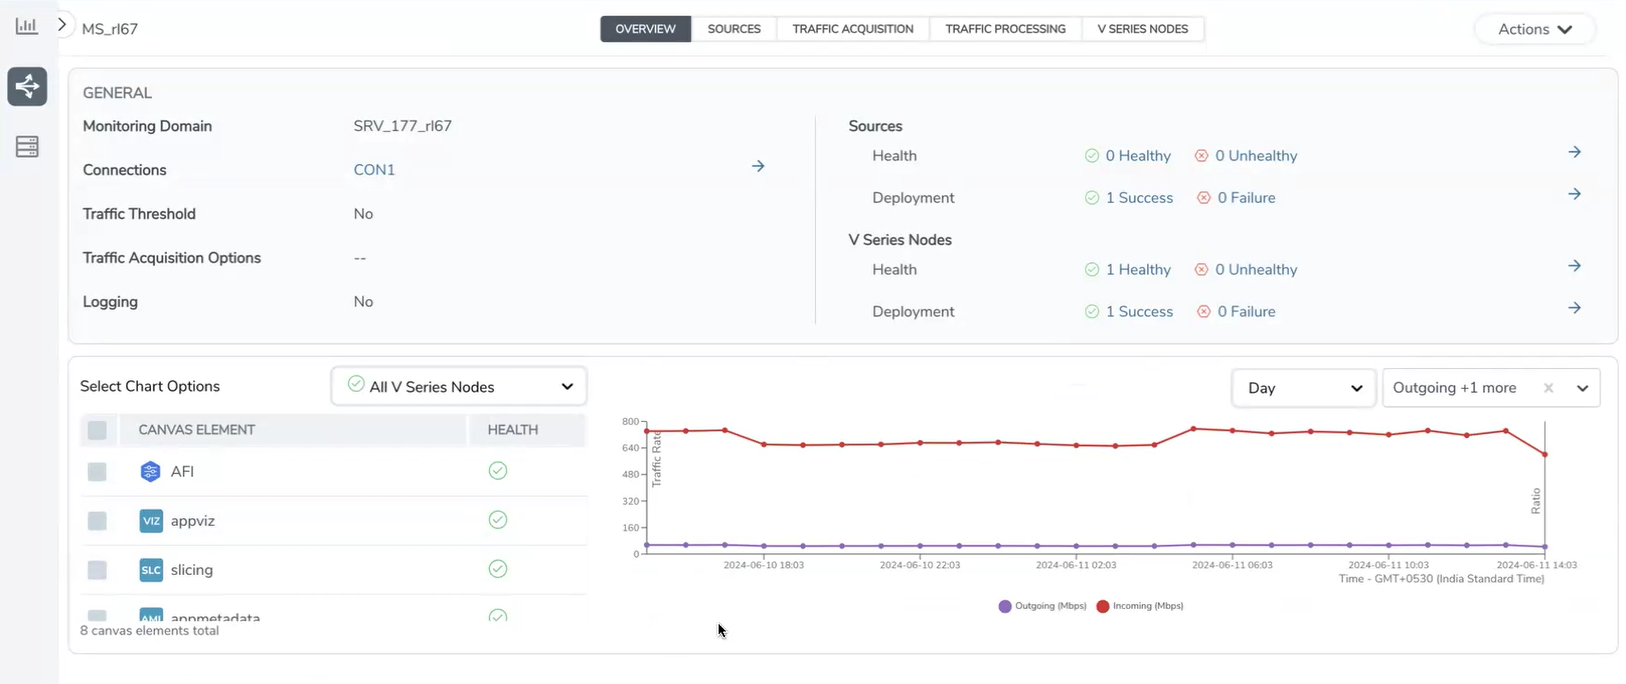
The Monitoring Session OVERVIEW page lets you analyze the incoming and outgoing traffic on an hourly, daily, weekly, and monthly basis.
You can view the high level information of the selected Monitoring Session such as, connections, tunnel details, health status, deployment status, and information related to Application Intelligence statistics. You can view the detailed statistics of an individual traffic processing element in the TRAFFIC PROCESSING tab.

You can view the statistics by applying different filters as per the requirements of analyzing the data. GigaVUE‑FM allows you to perform the following actions on the Monitoring Session Statistics page:
| You can view the incoming and outgoing traffic on an hourly, daily, weekly, and monthly basis. |
| You can filter the traffic and view the statistics based on factors such as Incoming, Outgoing, Ratio (Out/In), Incoming Packets, Outgoing Packets, Ratio (Out/In) Packets. You can select the options from the drop-down list box in the TOTAL TRAFFIC section of the OVERVIEW page. |
| You can also view the statistics of the Monitoring Session deployed in the individual V Series Nodes. To view the statistics of the individual GigaVUE V Series Node, select the name of the V Series Node for which you want to view the statistics from the GigaVUE V Series Node drop-down list on the bottom left corner of the OVERVIEW page. |


