View the Application Intelligence Dashboard
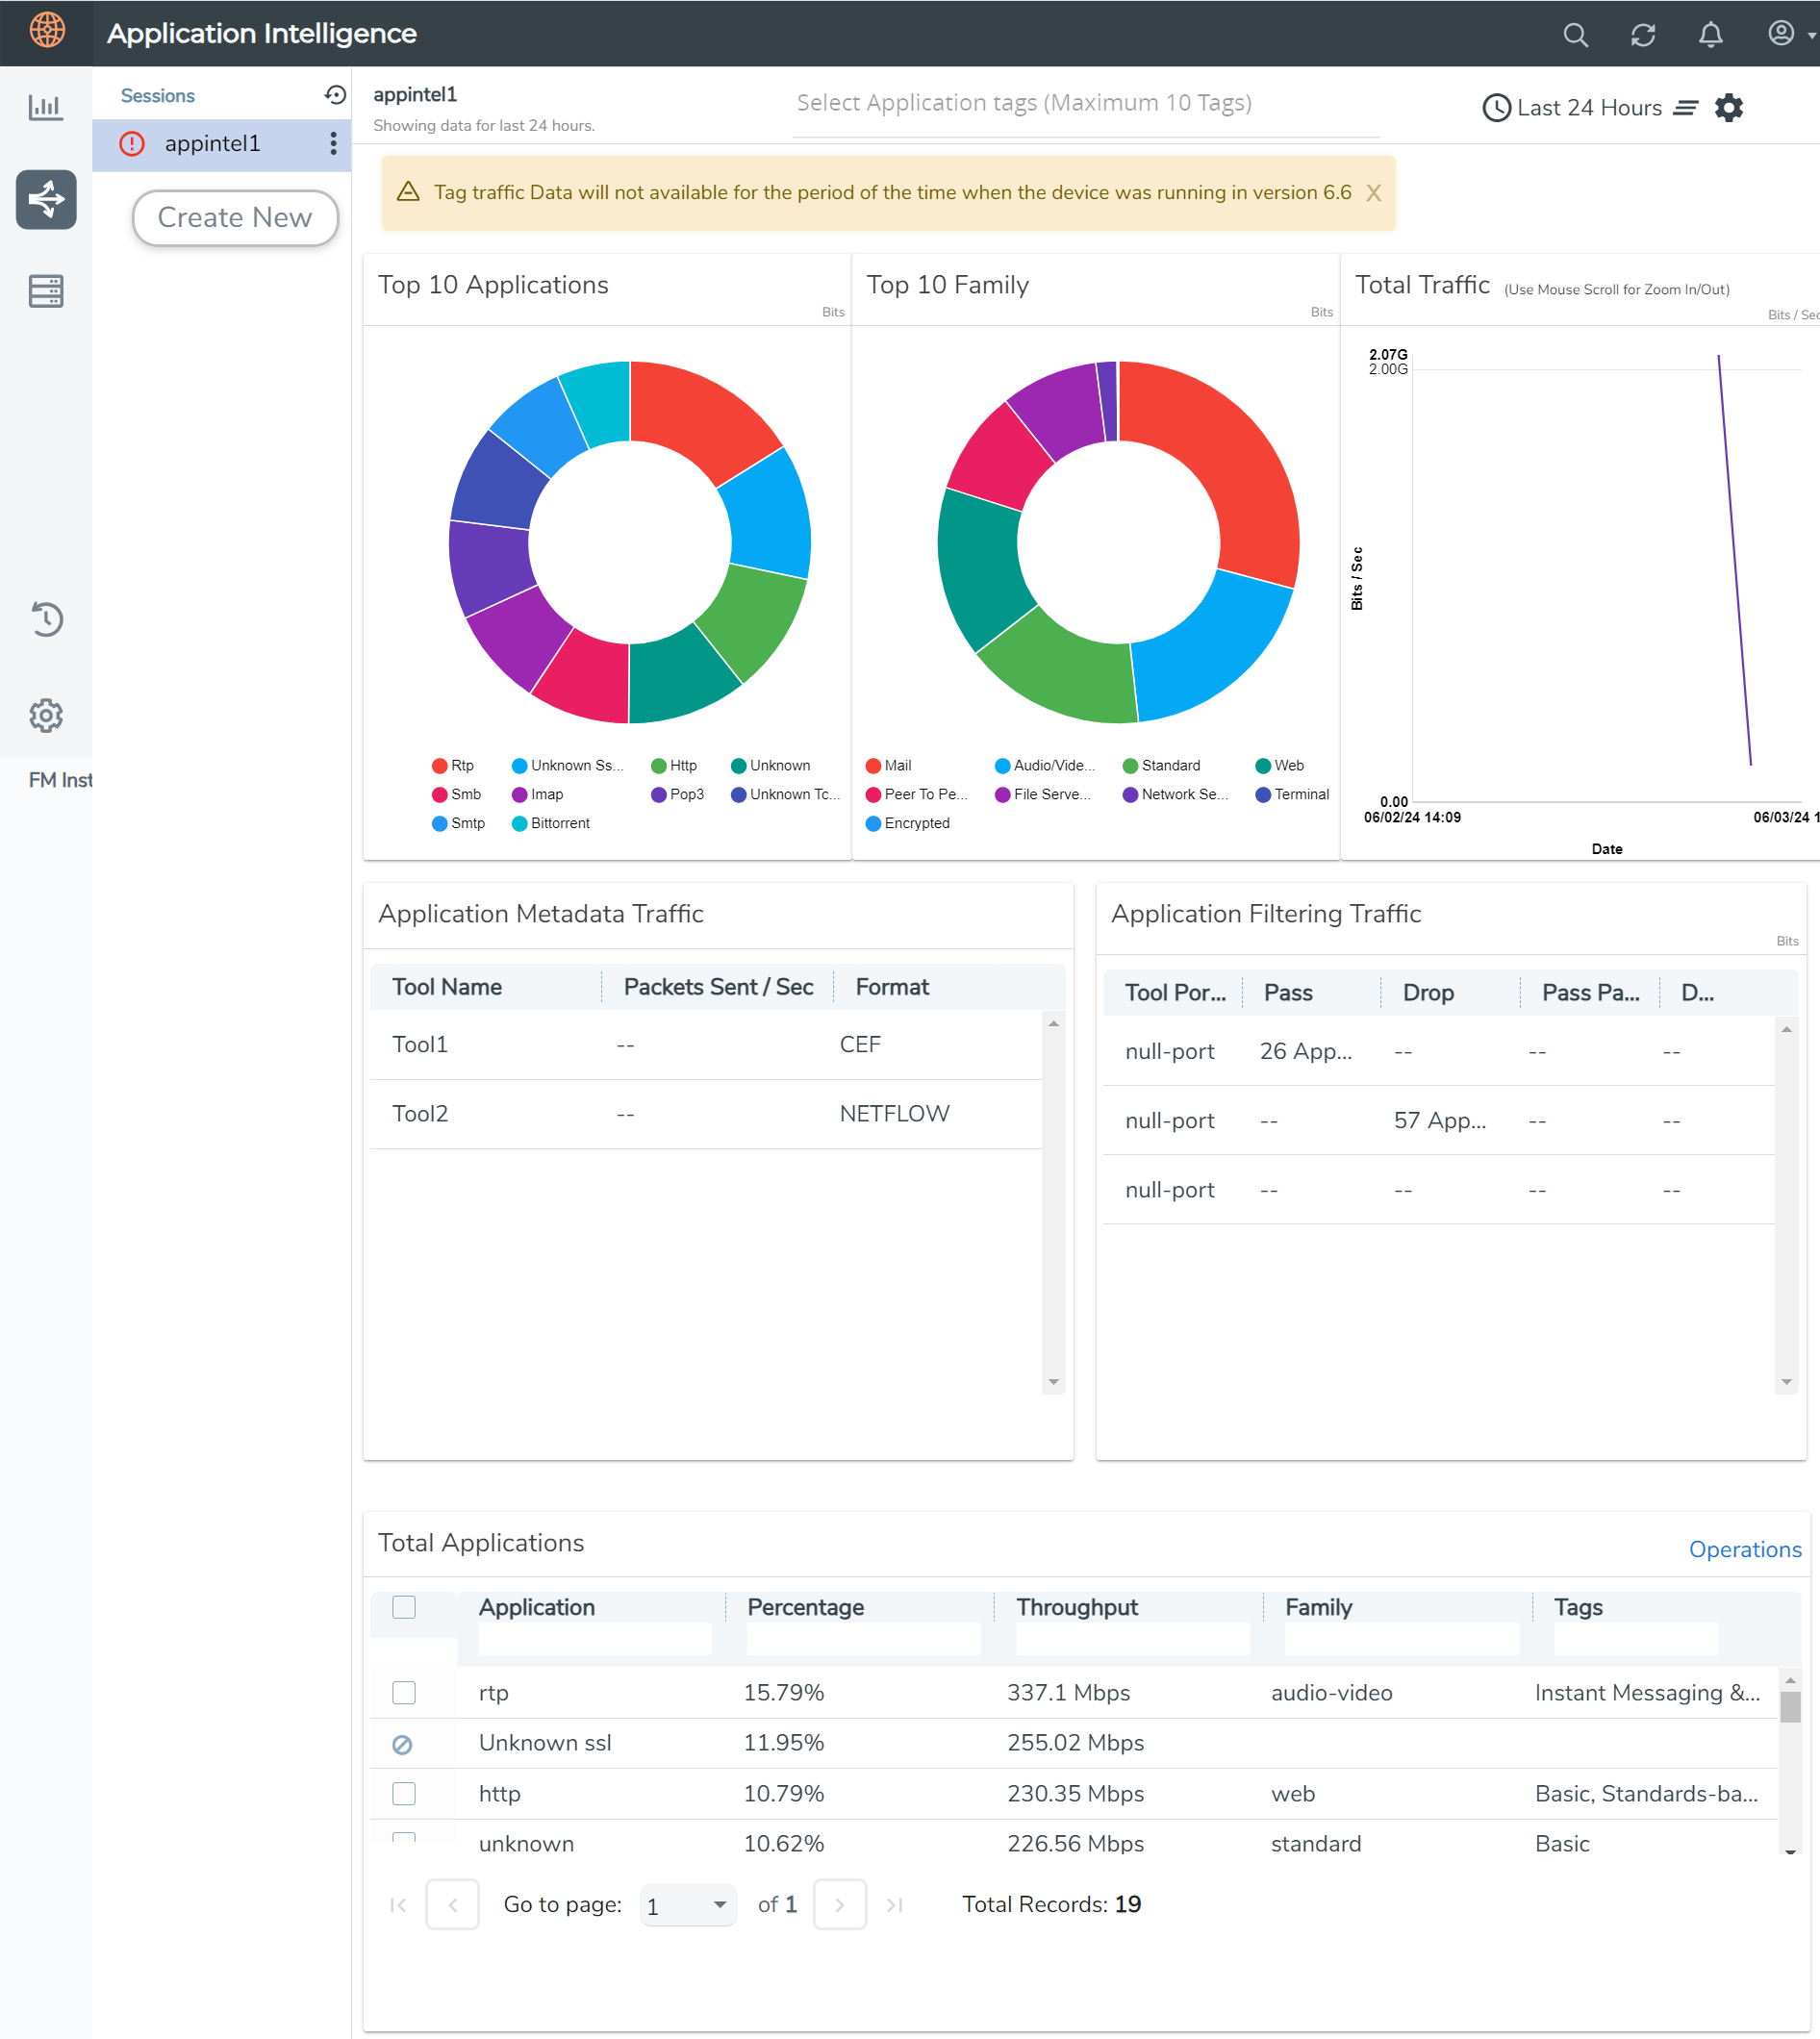
After creating the Application Intelligence Session, you can monitor the applications in the network by the reports displayed in the Dashboard as shown in the following figure:

Application Intelligence Dashboard displays the following metrics:
Note: The Top 10 Application Families metric and the Select Application Tags option are supported only on Gen 3 GigaSMART module and available from software release version 6.7.00 only.
|
■
|
Top 10 Applications: You can view a graphical representation of top 10 applications running in the network based on the metrics. When you hover over the Pie-chart, GigaVUE‑FM shows the application name in the network. The legend for the Pie-chart appears at the bottom. When you select a pie, you can view the corresponding data highlighted in the Total Applications table. |
|
■
|
Top 10 Application Families: You can view a graphical representation of top 10 application families running in the network based on the metrics. When you hover over the Pie-chart, GigaVUE‑FM shows the application family name in the network. |
Note: The Top 10 Applications Pie-chart may include user defined applications, but their corresponding Application Family will not be seen in the Top 10 Application Families Pie-chart. The user defined applications are not categorized under any family. So, if user defined applications are involved, there may be a variation in the Top 10 Applications and Top 10 Application Families Pie-charts.
|
■
|
Total Traffic: You can view the total traffic of the network represented in the linear form of a graph. |
|
■
|
Total Applications: You can view the applications and their bandwidth in the network. You can also select the required application for filtering and exporting metadata by using the Operations field. When the following application family names are displayed in the Application list, it implies that the application could not be successfully identified: |
|
o
|
unknown — unknown application name and protocol |
|
o
|
unknown-TCP — unknown application name that belongs to TCP flow. |
|
o
|
unknown-HTTP —unknown application name that belongs to HTTP flow. |
|
o
|
unknown-UDP —unknown application name that belongs to UDP . |
|
o
|
unknown-SSL —unknown application name that belongs to SSL flow. |
Note: You can filter the applications listed under Total Applications using the parameters such as Application, Percentage, Throughput, Family, and Tags.
Note: You can forward the unknown application family traffic to a packet capture tool, analyze the packet capture and configure User Defined Application signatures to identify them.
|
■
|
Application Filtering Traffic: You can view the statistics of the applications that are filtered in the tool ports in the dashboard after creating an Application Filtering Intelligence session for a device. You can view the number of applications that are dropped and passed through for the Application Filtering Traffic. |
|
■
|
Application Metadata Traffic: You can view the details of the Tool Name and the Format in which the metadata of the application is exported. |
You can use the Select Application Tags option to filter the traffic specific to the selected application tags. On selecting the tags for filtering, the following widgets will show only the data specific to the selected tag:
|
o
|
Top 10 Application Families
|
GigaVUE‑FM enables you to view the above metrics for a particular period by selecting the date and time from the dashboard.
GigaVUE-FM takes more than five minutes to display the application statistics since the export interval is fixed at five minutes. For the first fifteen minutes after creating the solution, if GigaVUE‑FM receives traffic, it will show real-time data. If there is no traffic during this time, it will take at least eleven minutes to display the statistics once traffic is received.
You can also choose to view the graphs in the dashboard for the metrics in bytes, packets or flows. To view the metrics in bytes, packets or flows, click the gear  button in the right corner of the Application Intelligence dashboard.
Note: By default, you can view the metrics in the dashboard for the last one hour, if the period is not selected.
Note: After upgrading to 6.4.00, you will lose the complete historical application visualization data except for the last twenty-four hours.

![]() button in the right corner of the Application Intelligence dashboard.
button in the right corner of the Application Intelligence dashboard. 


