GigaVUE‑FM
Homepage
When you first login to GigaVUE‑FM, the Dashboard - Physical & Virtual page is displayed by default as shown in the following figure.
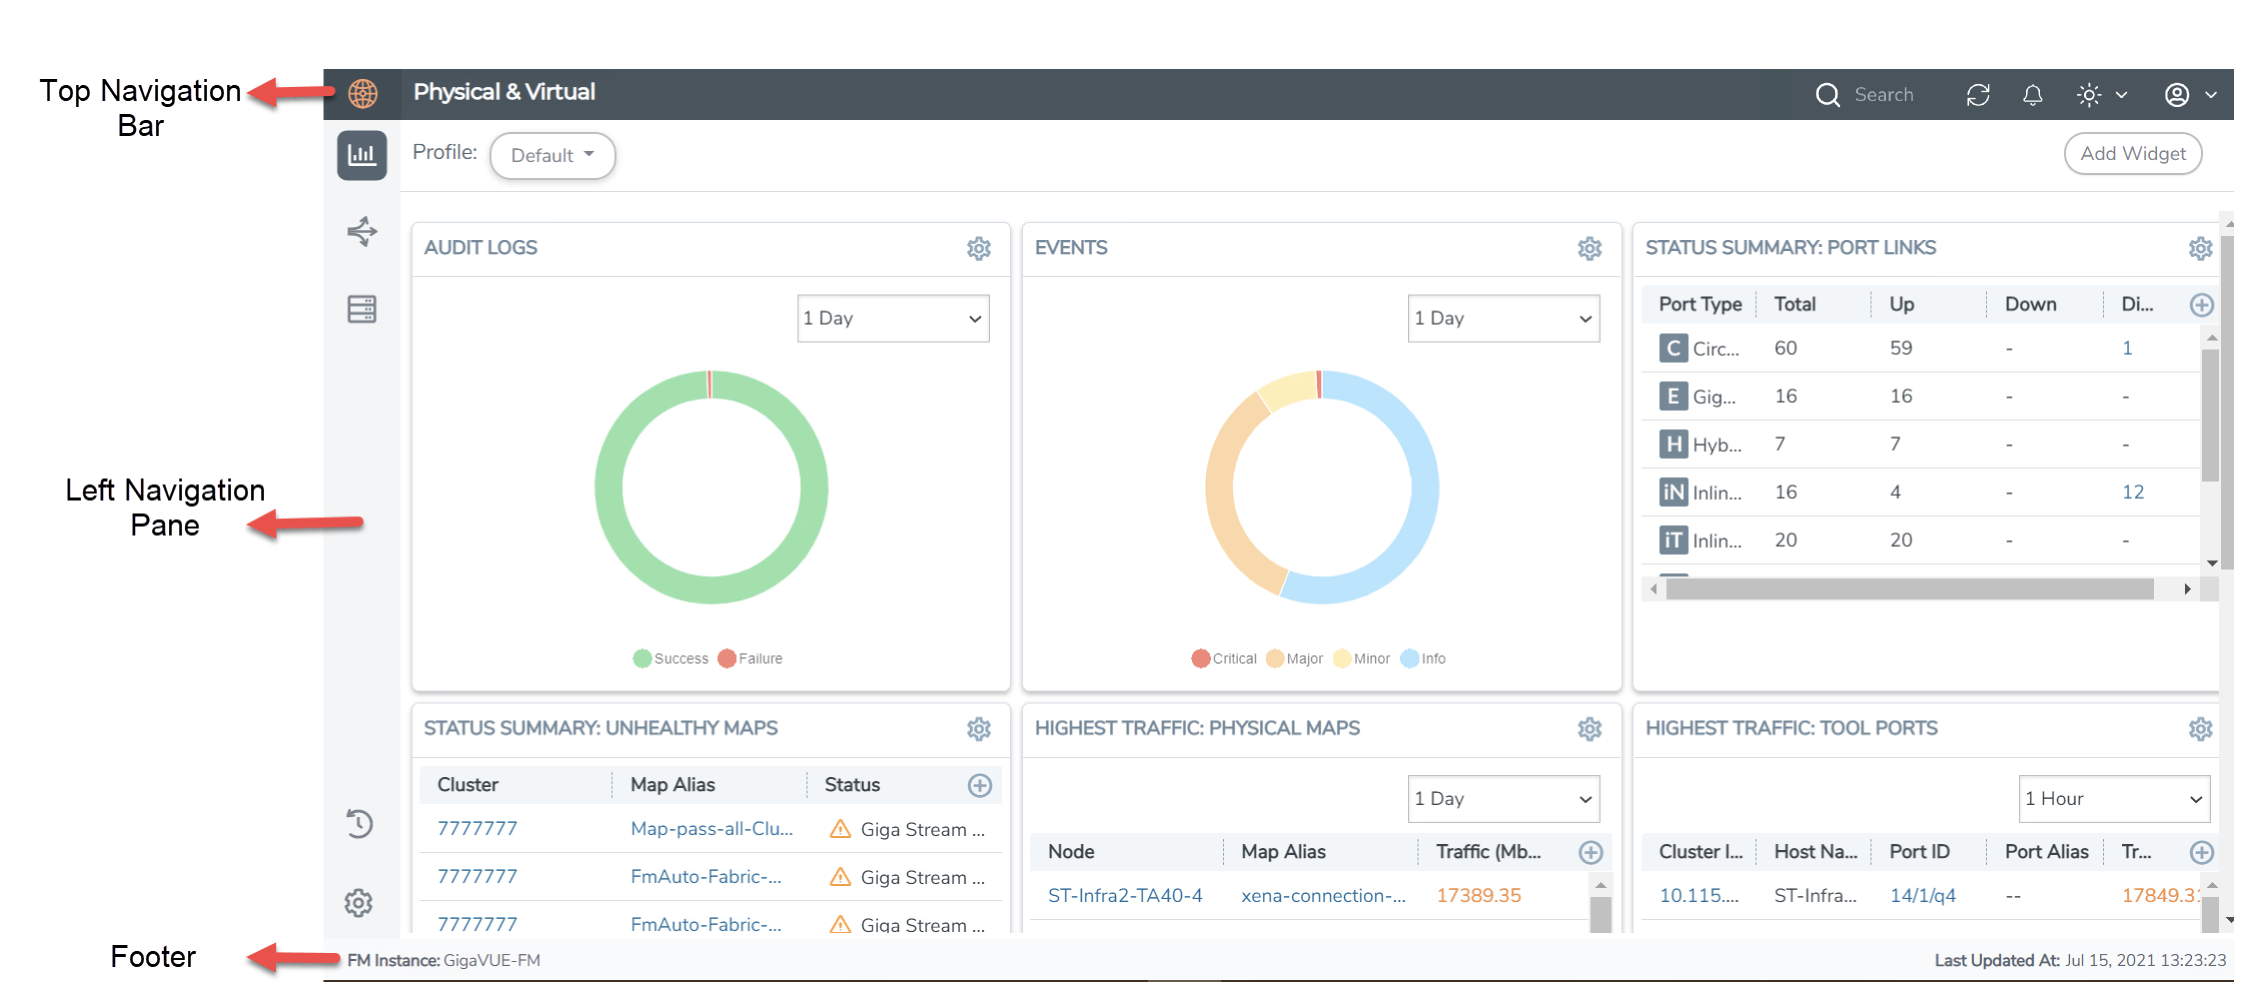
Left Navigation Pane
The GigaVUE‑FM GUI landing page has a left navigation pane that expands into a floating pane which navigates to the following menus :
Dashboards
 : Consists of the physical and virtual dashboards, the health monitor dashboards, and the Analytics dashboards. This page also includes the alarms, the events, and the audit logs pages. : Consists of the physical and virtual dashboards, the health monitor dashboards, and the Analytics dashboards. This page also includes the alarms, the events, and the audit logs pages. |
Traffic
 : Consists of the fabric solutions which the users must configure to monitor the flow of traffic. : Consists of the fabric solutions which the users must configure to monitor the flow of traffic. |
Inventory
 : Consists of the physical and virtual resources which the users must configure before configuring the traffic flow and solutions. : Consists of the physical and virtual resources which the users must configure before configuring the traffic flow and solutions. |
Recently Viewed  : Displays the list of recently viewed pages. Refer to Recently Viewed Section for detailed information. : Displays the list of recently viewed pages. Refer to Recently Viewed Section for detailed information. |
| Settings
|
Top Navigation Bar
The top navigation bar of the GUI contains page-level headers, Search ![]() , Refresh
, Refresh  , Theme
  , and Profile
  options. Also, the Help
  option is available under . To create keyboard shortcuts to navigate to different menu pages, click on and select Keyboard Shortcuts. For more information on the Theme icon refer to Theme Settings.
Note: The Save Configuration  option is available in the Node Overview, Flow Maps, and Active Visibility pages.
Page-Level Header
The page-level headers of the GigaVUE‑FM instance are displayed as shown in the figure.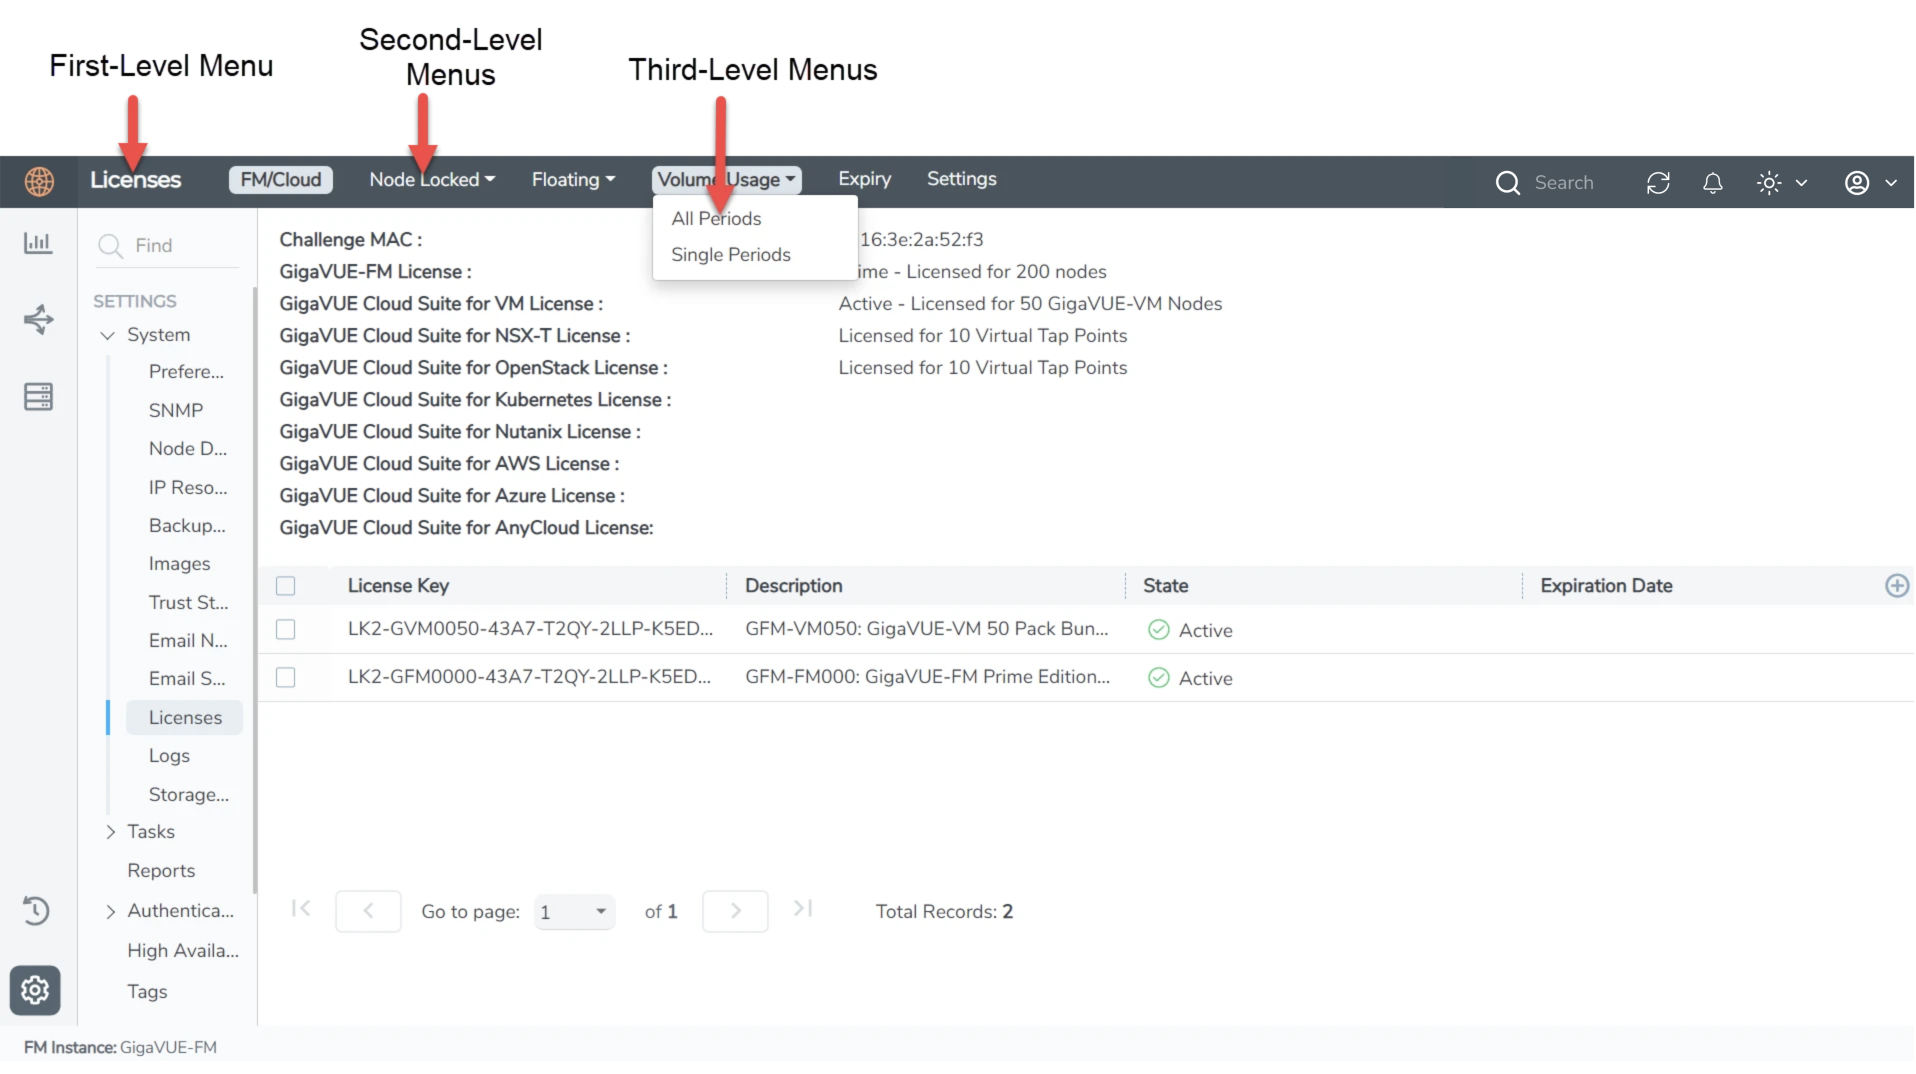
| The first-level menu is displayed as the Main Header in the top navigation bar. |
| The second-level menus are displayed next to the first-level menu. |
Note: The second-level menus that overflow in the top navigation bar are displayed as a drop-down with an option to expand or collapse.
| The third-level menus are displayed as drop-down under the second-level menus. |
GigaVUE-FM GUI Navigation
Use the navigation sidebar and the appropriate page-level headers to navigate to the various GUI pages. Depending on the user role and access rights of the user, the fields and buttons in the individual pages may either be enabled or disabled. Mandatory fields in the GUI are pages are notified appropriately.
Footer
The footer of GUI displays the GigaVUE‑FM instance name, Node Synchronized time when accessing pages related to nodes, and NRT time stamp.
Theme Settings
The theme setting options  allow you to choose among light, dark, and system themes. Once the theme is set, the settings remain the same, even when you log out of GigaVUE‑FM, close or reopen the browser, or open a new tab for GigaVUE‑FM. It is also independent of the browser settings.
The following table shows the options available when you click on the theme settings  icon:
icon:
|
S.No |
Options |
Description |
|---|---|---|
| 1 | Light theme |
UI changes to light color. It is the default theme. |
| 2 | Dark theme  |
UI changes to Dark color. |
| 3 | System |
UI applies the theme based on the Operating System theme settings. |
Note: When you cannot view the theme changes applied in Fabric Health Analytics (FHA), clear the browser cache and reload to view the updated changes.


