Create a Monitoring Domain
GigaVUE-FM connects to the VPC through the EC2 API endpoint. HTTPS is the default protocol which GigaVUE-FM uses to communicate with the EC2 API. For more information about the endpoint and the protocol used, refer to AWS service endpoints.
GigaVUE-FM provides you the flexibility to connect to multiple VPCs. You can choose the VPC ID and launch the GigaVUE Cloud Suite for AWS components in the desired VPCs.
Note: To configure the monitoring domain and launch the fabric components in AWS, you must be a user with fm_super_admin role or a user with write access to the Physical Device Infrastructure Management category.
To create a Monitoring Domain:
- Go to Inventory > VIRTUAL > AWS , and then click Monitoring Domain.
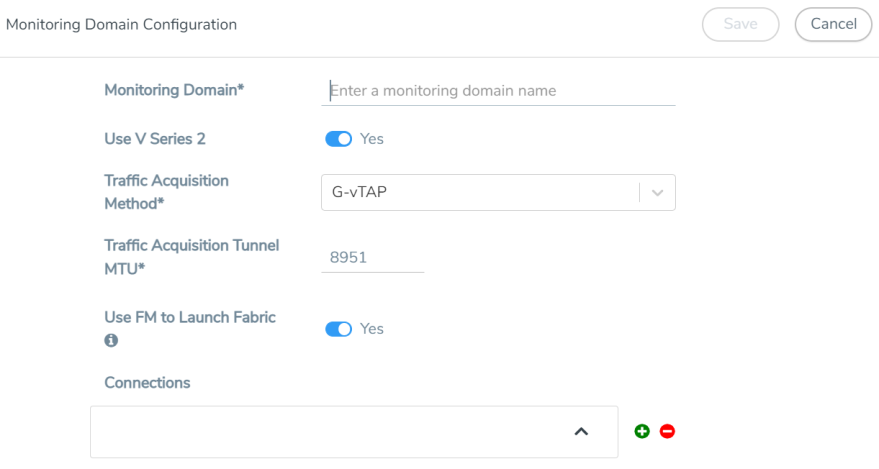
- On the Monitoring Domain page, click the New button. The Monitoring Domain Configuration page appears.

- Enter or select the appropriate information as shown in the following table.
Field
Action Monitoring Domain
An alias used to identify the monitoring domain.
Use V Series 2 Select Yes to configure GigaVUE V Series 2 node. Traffic Acquisition Method
Select a tapping method. The available options are:
UCT-V: UCT-Vs are deployed on your VMs to acquire the traffic and forward the acquired traffic to the GigaVUE V Series nodes. If you select UCT-V as the tapping method, you must configure the UCT-V Controller to communicate to the UCT-Vs from GigaVUE-FM.
You can also configure the UCT-V Controller and UCT-Vs from your own orchestrator. Refer to Configure GigaVUE Fabric Components using AWS Orchestrator for detailed information.VPC Traffic Mirroring: If you select the VPC Traffic Mirroring option, the mirrored traffic from your workloads is directed directly to the GigaVUE V Series nodes, and you need not configure the UCT-Vs and UCT-V Controllers.
For more information on VPC Peering, refer to VPC peering connections in the AWS Documentation. Peering is required to send mirrored traffic from other VPCs into a centralized GigaVUE V Series deployment.
You can choose to use an external load balancer for VPC Traffic Mirroring. Select Yes to use load balancer. Refer to Configure an External Load Balancer for detailed information.- UCT-V Controller configuration is not applicable for VPC Traffic Mirroring.
- VPC mirroring does not support cross-account solutions without a load balancer.
- For VPC Traffic Mirroring option, additional permissions are required. Refer to the Permissions topic for details.
- After deploying the Monitoring Session, a traffic mirror session is created in your AWS VPC consisting of a session, a filter, sources, and targets. For more details, refer to Traffic Mirroring in AWS Documentation.
Customer Orchestrated Source: If you use select Customer Orchestrated Source as the tapping method, you can use the Customer Orchestrated Source as a source option in the monitoring session, where the traffic is directly tunneled to the GigaVUE V Series nodes without deploying UCT-Vs and UCT-V Controllers. The user is responsible for creating this tunnel feed and pointing it to the GigaVUE V Series node(s). Note: When using Observability Gateway (AMX) application, select the Traffic Acquisition Method as Customer Orchestrated Source.
Traffic Acquisition Tunnel MTU
The Maximum Transmission Unit (MTU) is the maximum size of each packet that the tunnel endpoint can carry from the UCT-V to the GigaVUE V Series node.
The default value is 8951. The UCT-V tunnel MTU should be 50 bytes less than the agent's destination interface MTU size.
Use FM to Launch Fabric
Select Yes to Configure GigaVUE Fabric Components in GigaVUE-FM or select No to Configure GigaVUE Fabric Components in AWS.
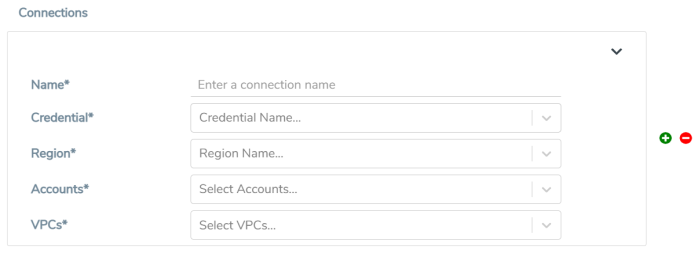
Connections

Note: You can add multiple connections in a monitoring domain. Refer to Create AWS Credentials for more information on adding multiple AWS Basic Credentials.
Name
An alias used to identify the connection.
Credential
Select an AWS credential. For detailed information, refer to Create AWS Credentials.
Region
AWS region for the monitoring domain. For example, US West.
Accounts
Select the AWS accounts
VPCs
Select the VPCs to monitor
- Click Save. The AWS Fabric Launch Configuration page appears.
You can view the details of the monitoring domain that are created in the list view. The list view details can be viewed based on:
You can also filter the monitoring domain based on a specified criterion. In the monitoring domain page there are two filter options as follows:
| Right filter - Click the Filter button on the right to filter the monitoring domain based on a specific criterion. |
| Left filter - Click the |
To edit or delete a specific monitoring domain, select the monitoring domain, click the ellipses  .
.
When you click a monitoring domain, you can view details of it in a split view of the window. In the split view window, you can view the details such as Configuration, Launch Configuration and V Series configuration.
Monitoring Domain
The list view shows the following information in the monitoring domain page:
| Monitoring Domain |
| Connections |
| Tunnel MTU |
| Acquisition Method |
| Centralized connection |
| Management Network |
Note: Click the ![]() to select the columns that should appear in the list view.
to select the columns that should appear in the list view.
Use the following buttons to manage your Monitoring Domain:
| Button | Description | ||||||||||||||||||||||||
|
New |
Use to create new connection |
||||||||||||||||||||||||
|
Actions |
You can select a Monitoring Domain and then perform the following options:
|
||||||||||||||||||||||||
|
Filter |
Filters the Monitoring Domain based on the list view options that are configured:
You can view the filters applied on the top of the Monitoring Domain page as a button. You can remove the filters by closing the button. |
Connections Domain
To view the connection related details for a monitoring domain, click the Connections tab.
The list view shows the following details:
| Connections |
| Monitoring Domain |
| Status |
| Fabric Nodes |
| User Name |
| Region |
Fabric
To view the fabric related details for a monitoring domain, click the Fabric tab.
The list view shows the following details:
| Connections |
| Monitoring Domain |
| Fabric Nodes |
| Type |
| Management IP |
| Version |
| Status - Click to view the upgrade status for a monitoring domain. |
| Security groups |
UCT-V
To view all the UCT-Vs associated with the available Monitoring Domains click the UCT-V tab.
The list view shows the following details:
| Monitoring Domain |
| IP address |
| Registration time |
| Last heart beat time |
| Agent mode |
| Status |
.


