Configure UCT-C through GigaVUE-FM
This section describes how to configure UCT-C through GigaVUE-FM GUI. Refer to the following section for details.
- Launch GigaVUE-FM
- Create Monitoring Domain
- Create Source Selectors
- Create Tunnel Specifications
- Configure Traffic Policy
- Traffic Policy Statistics
The recent GigaVUE-FM image files can be downloaded from the Gigamon Customer Portal. After fetching the image, upload and launch GigaVUE-FM on your GigaVUE V Series Node supported cloud environment. For assistance,Contact Technical Support of Gigamon or refer to GigaVUE Cloud Suite for more information on GigaVUE V Series configuration on the supported cloud environments.
To create a monitoring domain in GigaVUE-FM:
- In GigaVUE-FM, on the left navigation pane, select Inventory > CONTAINER > Universal Cloud Tap - Container > Monitoring Domains. The Monitoring Domain page appears.
- In the Monitoring Domain page, click New. The New Monitoring Domain wizard appears.
- Enter or select the required information as described in the following table.
Fields
Description
Monitoring Domain Name
Enter a name for the monitoring domain
Connections
Connection Name
Enter a name for the UCT-C connection
Cluster Name
Enter a name for the cluster
URL
Enter the URL of the API server
Click
 to add another connection and click
  to remove an existing connection.
 - Click Save to create a monitoring domain.
Note: If the connecting UCT-C Tap does not send 3 continuous heart beats, it is marked as disconnected and it is shown on the monitoring domain page as per the interval configured in the UCT-C Purge (the default purge interval is 30 days) before the GigaVUE-FM cleans them up.
You can view the monitoring domain created in the list view. The list view shows the following information for UCT-C and controllers:
| Monitoring Domain |
| URL |
| Connection |
| Cluster Name |
| Cluster Version |
| Controller / TAP |
| UCT-C UUID |
| Management IP |
| Version |
| Node Name |
| Node Kernel Version |
| Status -If you enable Secure Tunnel, its status can be viewed in Monitoring Domain page. |
| Discovered Sources |
Note: You need to refresh pages manually in UCT-C Monitoring Domain and Policy Page as the automatic GUI refresh is disabled.
Use the following buttons to manage your Monitoring Domain:
| Button | Description | ||||||||||||
|
New |
Use to create new connection |
||||||||||||
|
Actions |
Provides the following options:
|
||||||||||||
|
Filter |
Filters the monitoring domain based on the following options:
|
- You can click on the Discovered Sources link to view the source details. In the Discovered Sources window, you can enable the Show System Pods button to view the information related to the system pods that are not monitored.
- Gigamon cannot tap traffic if hostnetworks are set to true in pods.
When setting up a traffic flow, it is important to define the selection criteria for the sources of traffic. Use the Source Selectors page for configuring the sources of the traffic to be monitored.
To configure the Source Selectors:
- Select Inventory > Resources> Source Selectors.
-
On the Source Selectors page, navigate to the Container tab and click Create.
The New Source Selector wizard appears.
- Enter or select the required information:
Field Action Name Enter a name for the source Include Filters (Criteria 1)
You can select any one of the following options
All Sources - Select this option to acquire traffic from all names, all pods and containers within the selected cluster(s). Depending on the size of the cluster(s), volume of traffic may be larger. Criteria1- You must enter the following options: Object Property Select an object property to filter the traffic source.
Operator Select the operator.
Values Enter the values for the filter. Values are case-sensitive. On the Criteria, click
to add another Object and click to remove an existing Object.Exclude Filters (Criteria 1)
On the Criteria, click
to add another Object and click to remove an existing Object.Object Property Select an object property to filter the traffic source.
Operator Select any one of the operators:
equals contains startswith endwith Values Enter the values for the filter. Values are case-sensitive. On the Include or Exclude filters, click
to add another Criteria and click to remove an existing Criteria. - Click Save to save the filter.
- If you have configured multiple filters in a criterion, then the traffic will be filtered only if all the filter rules are true.
- If you have configured multiple criteria, then the traffic will be filtered even if one of the criteria is true.
A tunnel of type L2GRE, VXLAN, or TLS-PCAPNG can be created. The tunnel is an egress tunnel. For more information to create a tunnel of type TLS-PCAPNG, refer to Secure Tunnels . Secure Tunnels
To configure the tunnels:
- Select Inventory > Resources > Tunnel Specifications.
-
On the Tunnel Specifications page, navigate to Container tab and click Create. The Create Tunnel Specification wizard appears.
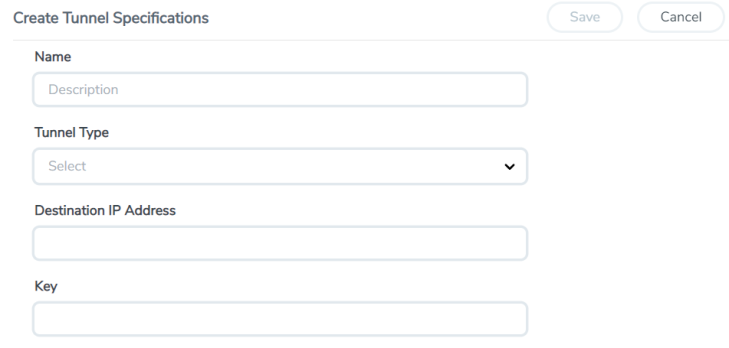
- Enter or select the following information:
- Click Save to save the configuration.
|
Field |
Description |
|
Name |
The name of the tunnel endpoint. |
|
Tunnel Type |
Select L2GRE, VXLAN, or TLS-PCAPNG tunnel type to create a tunnel. |
|
Destination IP Address |
Enter the IP address of the destination endpoint |
|
Key |
Enter a value for the tunnel key |
To create a UCT-C Traffic Policy in GigaVUE-FM:
- From the GigaVUE-FM left navigation pane, select Traffic > CONTAINER > Universal Cloud Tap - Container. The Policies page appears.
- In the Policies page, click Create. You can create a maximum of eight policies per monitoring domain. The Create Policy wizard appears.
- In the General tab, enter or select the required information as described in the following table:
Fields
Description
Policy Name
Enter a name for the Traffic Policy. The name must be unique.
Monitoring Domain
Select an existing monitoring domain. To create a new monitoring domain, refer to Create Monitoring Domain section.
Connections
Select one or more connections for the policy. Once traffic policy is created for monitoring domain, you cannot add or delete connections in a monitoring domain.
- Switch to the Source Selectors tab, select an existing source selector or select Create New to create a new source selector, refer to Create Source Selectors section for detailed information. You can configure a maximum of eight source selectors per policy.
- Switch to the Rules tab, enter or select the required information for the Ingress Rules and the Egress Rules as described in the following table. You must select CA in the Monitoring Domain page to use secure tunnel in rules:
Fields
Description
Rules
On the Ingress or Egress rules, click
to add another rule and click to remove an existing rule. You must select CA in the Monitoring Domain page to use secure tunnel in rules.Rule Name
Enter a name for the rule.
Note: Rule names ending with __I, __E, __RI, __RE are not recommended as the names are invalid in policy rules.
Enable
Select On to enable the filter or select Off to disable the filter
Action
Select Pass to allow the packets or select Drop to block the packets based on the filters.
Direction
Select any one of the following directions:
Bi-directional - Taps the traffic in both directions. The maximum number of rules supported per direction is 32. Also, each directional rule will add 2 ingress rules and 2 egress rules. Ingress- Taps the ingress traffic. Egress - Taps the egress traffic. Ingress Pass All - Taps all the ingress traffic. Egress Pass All - Taps all the egress traffic. Priority
Enter a priority value to specify the precedence.
Tunnel Specifications
Select an existing tunnel or select Create New to create a new tunnel, refer to Create Tunnel Specifications section for detailed information.
Filters
On the rule section, click
to add another filter and click to remove an existing filter.Filter Type
Select a filter type
Filter Name
Enter a name for the filter
Value
Enter a value for the filter
- Switch to the Deploy tab, click Deploy and the selected traffic policy rules get deployed to the required UCT-C taps present on the nodes corresponding to the source pods selected for monitoring.
The Traffic Policy processes the customer workload traffic and UCT-C forwards the traffic to the tunnel destination IP address.
Note: When there are two or more policies configured within the same tunnel, you cannot edit the tunnel specifications that are shared in the policies. In such cases, delete all the policies sharing the same tunnel specifications, modify the existing tunnel specifications, and create new policies for the policies that are deleted using the modified tunnel specifications.
Traffic Policy Statistics
Traffic Policy Statistics in the GigaVUE-FM provides the visibility of the policies within a Monitoring Domain and displays the information of the policies and its rules statistics in the dashboard.
Rules are configured in the UCT-C to either forward the traffic to a Tunnel or drop the flow of the traffic.
The activities of the rules are reflected by the statistics counters. The statistics counters show how the policy statistics are directly co-related to the policy and its rules being configured through the GigaVUE-FM.
Viewing Policy Statistics
To view the statistics of the traffic policy configured in the GigaVUE-FM, do the following steps:
| 1. | Go to Traffic> Container > UCT-C. The Policies page appears. In the policy page, you can view various details related to a policy such as Name, Monitoring Domain, Connection, Status, etc., For each policy, the value correspond to the aggregate value of UCT-C taps associated with that policy. The fields and the description of the field names are given in the following table: |
|
Fields |
Description |
|---|---|
|
Name |
Name of the Policy |
|
Monitoring Domain |
Monitoring Domain associated with the Policy. |
|
Connection |
The connection associated with the policy. |
|
Status |
Specifies whether the policy deployment is :
|
|
UCT-C Deployment Details |
Specifies the count of successful deployment along with the total number of deployment for a policy. |
|
Ingress packets |
Total aggregate value of the ingress packets associated with the policy. |
|
Egress packets |
Total aggregate value of the egress packets associated with the policy. |
|
Rx Dropped |
Total aggregate value of the ingress packets dropped associated with the policy |
|
Ingress Dropped |
Total aggregate value of the ingress packets dropped associated with the policy |
|
Tx Dropped |
Total aggregate value of the egress packets dropped associated with the policy. |
|
Egress Dropped |
Total aggregate value of the egress packets dropped associated with the policy. |
|
Ingress Bytes |
Total aggregate value of the ingress bytes associated with the policy. |
|
Egress Bytes |
Total aggregate value of the egress bytes associated with the policy. |
|
Ingress Errors |
Total aggregate value of the ingress errors associated with the policy. |
|
Egress Errors |
Total aggregate value of the egress errors associated with the policy. |
Note: Click the Gear icon ![]() to add or remove column or columns as per your requirement.
to add or remove column or columns as per your requirement.
| 2. | Click the name of a policy to view the statistics of the policy. The statistics appears on the bottom of the Policies page. |
You can view the following tabs along with the policy name:
| Source Specifications |
| Rules |
You can scroll each of the tables to view more columns. The fields and description for the tab that appears when you click the tabs are described in the topics respectively.
Source Specifications
You can view the criteria based on which a pod is selected for tapping.
The fields and descriptions of the source specifications tab are described in the following table:
|
Tab- Source Specifications |
Field |
Description |
|---|---|---|
|
Source Selector |
||
|
|
Name |
Specifies the name of the Source selector. |
|
Include Criteria |
||
|
|
Criteria Name |
Specifies the include criteria for the source selector. Pod that matches the include criteria is part of the source for the given traffic policy. |
|
Property |
Specifies the attributes of the pod. The available attributes are: service
|
|
|
|
Operator |
Specifies the operator used in the criteria. |
|
|
Value |
Specifies the value for the attributes in the criteria. |
|
Exclude Criteria |
||
|
|
Criteria Name |
Specifies the exclude criteria for the source selector. Pod that matches the exclude criteria will be excluded from the source for the given traffic policy. |
|
|
Property |
Specifies the property in the exclude criteria based on which the pod associated with the source is excluded. |
|
|
Operator |
Specifies the operator involved in the exclude criteria in tapping the traffic in the pod. |
|
|
Value |
Specifies the value in the criteria based on which traffic in the pod is excluded. |
Rules
You can view the aggregate value of all the rules the policy has been configured for the node in the UCT-C tap present in a cluster. The fields and descriptions of the source specifications tab are described in the following table:
|
Tab-Rules Rules |
Field |
Description |
|---|---|---|
|
Rules |
|
|
|
|
Name |
Specifies the name of the rules in which the traffic is filtered in the pod |
|
|
Tunnel Specifications |
Specifies the tunnel details which is associated with the rules to send the traffic out. When you hover over the tunnel specification value, you can view the details of the tunnel in a message box |
|
|
Priority |
Specifies the priority assigned for the rule. |
|
|
Pass/Drop |
Specifies whether to pass or drop the rule. |
|
|
Filters |
Specifies the parameters used in the rule. When you hover over the filter value, you can view the details of the filters in a message box. |
|
|
Direction |
Specifies the direction of the flow of traffic is ingress, egress, or in both direction. |
|
|
Ingress Packets |
Specifies the aggregate value of the ingress packets associated with the rules. |
|
|
Egress Packets |
Specifies the aggregate value of the egress packets associated with the rules. |
|
Ingress Dropped |
Specifies the aggregate value of the ingress packets dropped associated with the rules. |
|
|
Egress Dropped |
Specifies the aggregate value of the egress packets dropped associated with the rules. |
|
|
Ingress Errors |
Specifies the aggregate value of the ingress errors associated with the rules. |
|
|
Egress Errors |
Specifies the aggregate value of the egress errors associated with the rules. |


