View Monitoring Session Statistics
The Monitoring Session Statistics page lets you analyze the incoming and outgoing traffic on an hourly, daily, weekly, and monthly basis.
On the Monitoring Sessions page, click the name of the monitoring session, and then click View. A split window appears displaying the Statistics, Connections, V Series Nodes, Source Health and Http2 Logging of the monitoring session as shown:
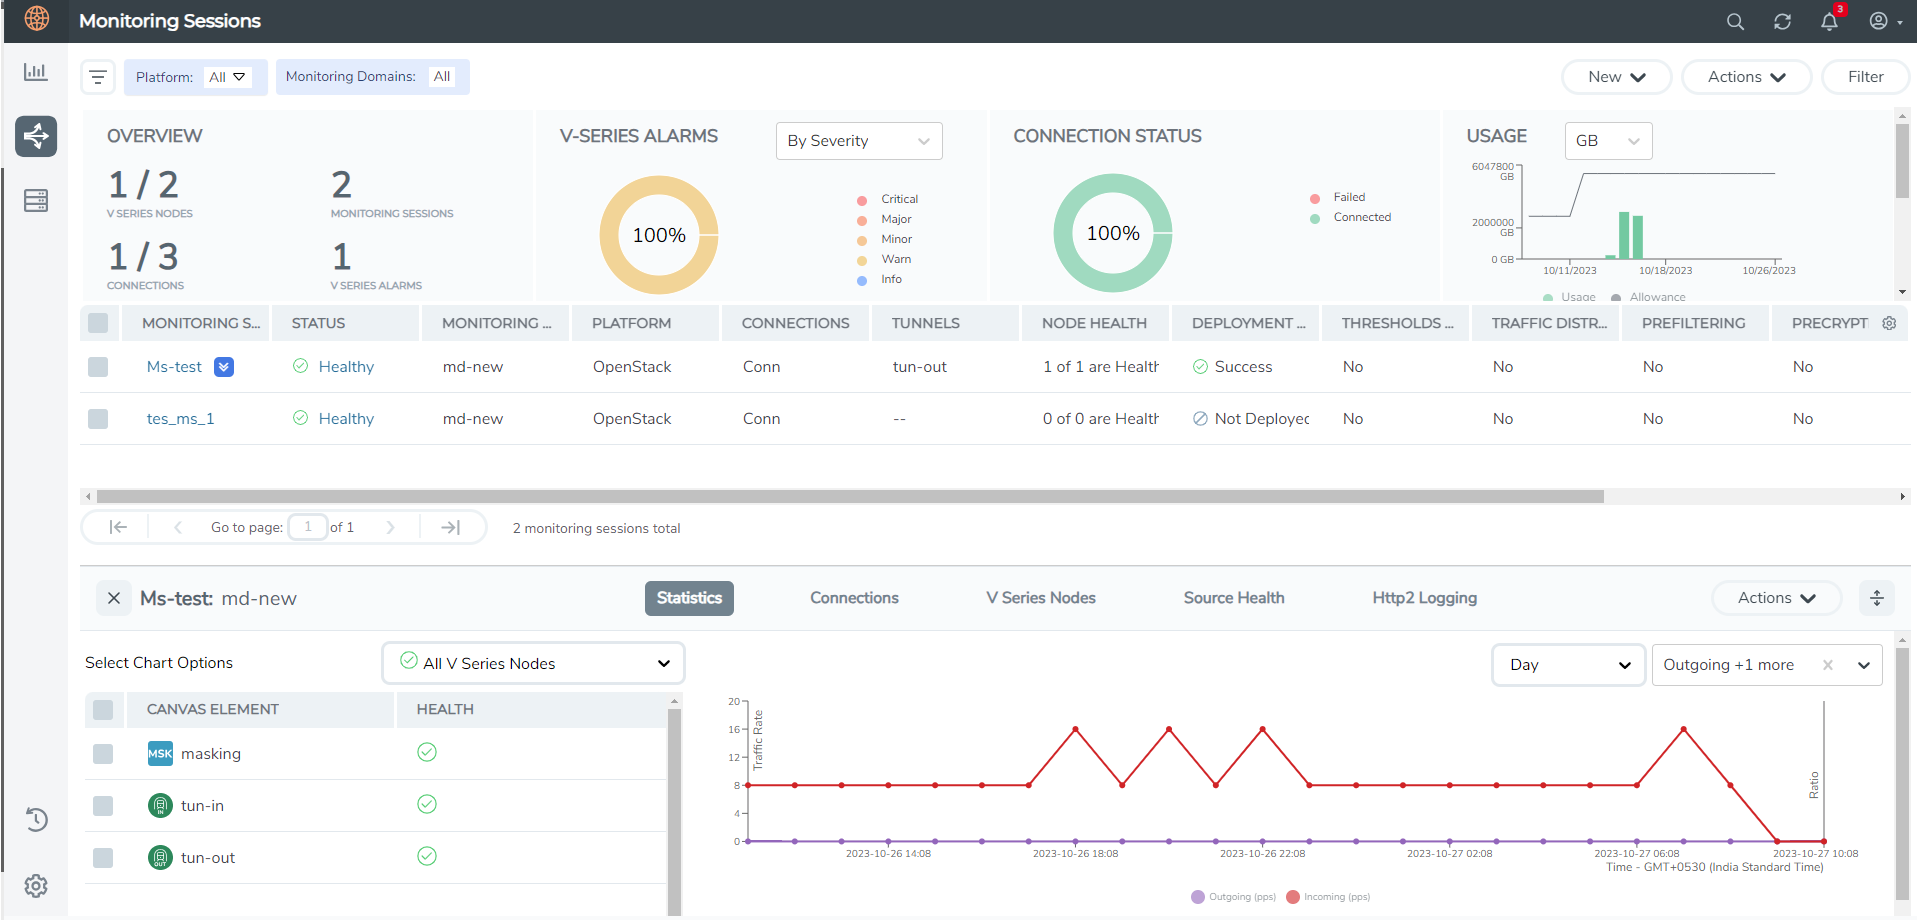
To know more about the statistics of the session, click Statistics.
You can view the statistics by applying different filters as per the requirements of analysing the data. GigaVUE‑FM allows you to perform the following actions on the Monitoring Session Statistics page:
|
■
|
You can view the Statistics in full screen. To view in full screen, click the Actions drop-down list at the right corner of the window, and select Full Screen. Statistics appear in full screen. |
|
■
|
You can view the incoming and outgoing traffic on an hourly, daily, weekly, and monthly basis. You can select the options from the drop-down list box. |
|
o
|
For the hourly statistics, the data points are plotted every five minutes. |
|
o
|
For the daily statistics, the data points are plotted every one hour. |
|
o
|
For the weekly statistics, the data points are plotted every six hours. |
|
o
|
For the monthly statistics, the data points are plotted every day. |
|
o
|
The data points in graph are plotted every five minutes, one hour, six hours, or a day based on the option selected in the drop-down menu. |
Note: The latest data point displayed in the graph for any particular time will be less than five minutes, one hour, six hours, or day from the time at which the statistics are checked based on the option selected from the drop-down menu. For example, if you are viewing the hourly statistics at 11.30, the latest data point in the graph would be 11.25.
|
o
|
The statistical data between two data points is displayed at the first data point. For example, the data between 11.30 and 12.30 is displayed at the data point 11.30 when viewing the daily statistics. |
|
■
|
You can filter the traffic and view the statistics based on factors such as Incoming, Outgoing, Ratio (Out/In), Incoming Packets, Outgoing Packets, Ratio (Out/In) Packets. You can select the options from the drop-down list box. |
|
■
|
You can also view the statistics of the monitoring session deployed in the individual V Series Nodes. To view the statistics of the individual GigaVUE V Series Node, select the name of the V Series Node from the drop-down list for which you want to view the statistics from the GigaVUE V Series Node drop-down menu on the top left corner of the Monitoring Session Statistics page. |
- You can view the statistics of the elements involved in the monitoring session. To view the statistics, click on the Select Chart Options page and select the elements associated with the session.
- Directly on the graph, you can click on Incoming(Mbps), Outgoing (Mbps), or Ratio (Out/In) (Mbps) to view the statistics individually.


