Troubleshoot Flexible Inline Flows
The flexible inline canvas provides you with the ability to view the status of the flexible inline flow deployments, port statistics, and the details of the cluster-level maps used in the deployments. You can use these details to troubleshoot any issues or failures in your flexible inline flows.
The flexible inline canvas has the following tabs:
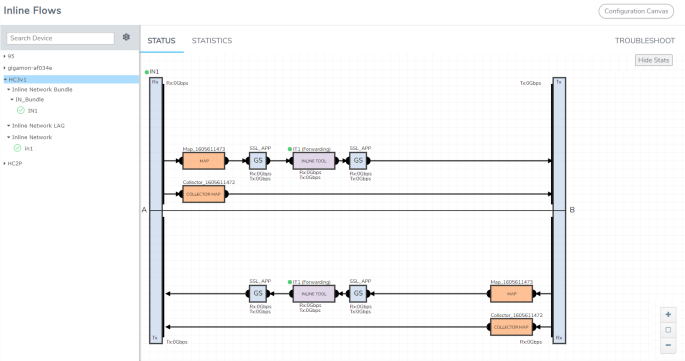
The Status tab provides details of the forwarding states of inline network. Click the required component that is part of the selected inline network to view the component’s properties. Refer to View the Forwarding States of Inline Networks.
It also provides the status of the components that are part of the selected inline network. Hover over the status to view the description.
Click the Show Stats/Hide Stats toggle button to view the Rx/Tx rate for the components that are part of the flexible inline flow deployment. Refer to the following figure for details.
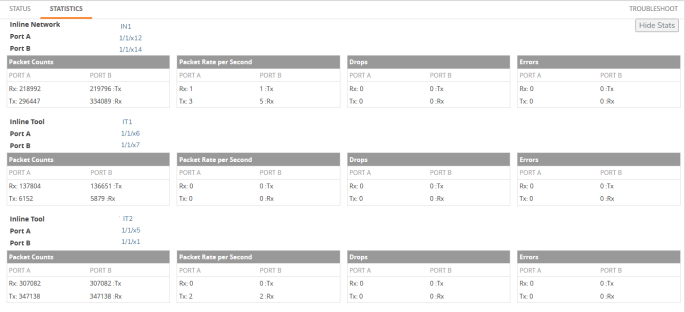
The Statistics tab provides statistical information of the inline network ports, inline tool ports, and the virtual ports used in the selected inline network. It also provides the inline decryption session statistics for the inline network. The inline network, inline tools, ICAP Client, and the ports aliases are displayed as clickable links. Use these links to access the quick view of the respective component. Refer to the following figure for details.
HSM Statistics
To view HSM Statistics, click the View HSM Stats button on the Statistics tab.
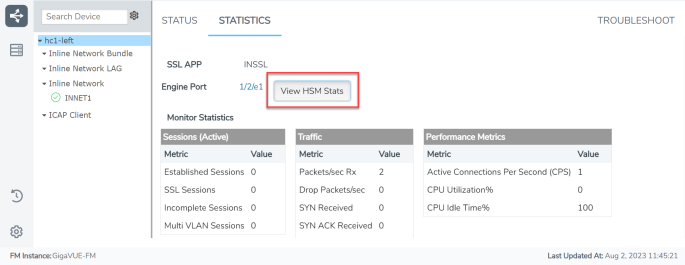
The HSM Statistics window includes the following tabs:
| Client Statistics tab, which includes information on number of requests received and responses sent, metrics, and error details. |
| Server Statistics tab, which includes details on the number of requests sent and responses received, delay, and average time drop details. |
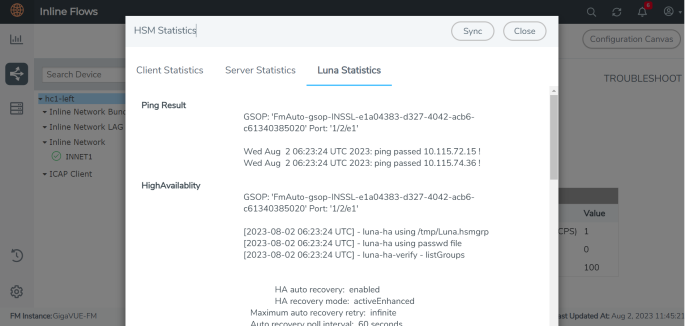
| Starting in software version 6.4, Luna Statistics is included in the HSM Statistics window. The Luna Statistics tab provides statistical information on the Ping Result, High Availability, and the verification details. |
The Show Stats option will be displayed after the ICAP Client app is configured and deployed. The Show Stats option has the following tabs:
-
Statistics
-
Session
The Statistics tab provides statistical information on the GigaSMART group, GS engines, inline network, IP interface port, and server statistics. Click the drop-down menu of each component listed on the statistics page to know more about the configuration details. You can also view the statistics from the sidebar on the Inline Flows page.
The GS Engine drop-down menu provides information on the ICAP session statistics. Click Clear GS Stats to clear the statistics of the GS group.
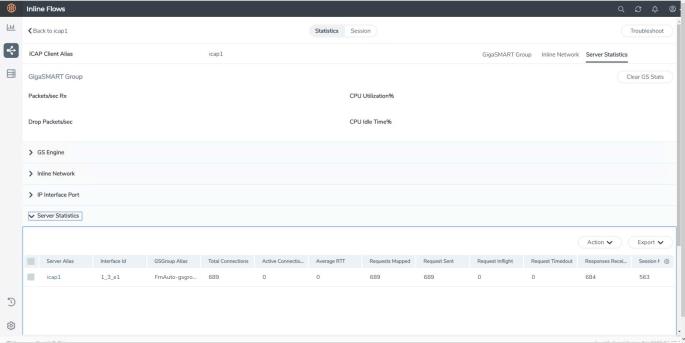
To view ICAP session statistics details, click the Sessions tab.
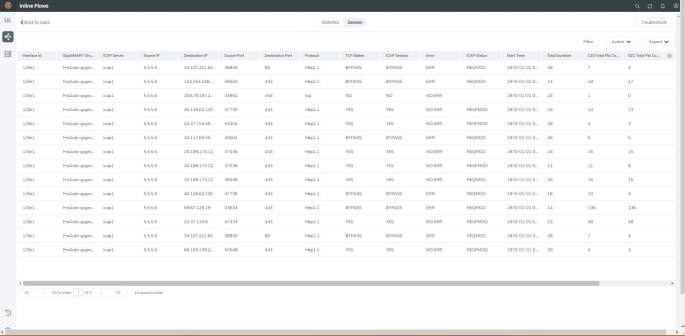
Refer to the below table for more details on the sessions tab.
|
Field |
Description |
|
Filter |
To view the statistics of a particular IP with selected parameters. |
|
Action |
Upload to server: To export the log details to an external server. |
|
Export |
To export the current session details to local. |
Click the Troubleshoot button to view more on the below map configuration details for the ICAP Client app:
-
Map Alias
-
From
-
To
-
GSOP
The Troubleshoot tab provides details about the device-level maps that are created for the selected inline network. The details include the source of the map, inline tools or inline tool groups used in the A to B and B to A directions, tool side and network side VLAN tags, and OOB copies. Click the required component to view its configuration details. It also provides details about the map statistics. In case of inline tool group, you can view the list of inline tools that are associated with the inline tool group. Click the required inline tool from the list to view its configurations. Refer to the following figure for details.
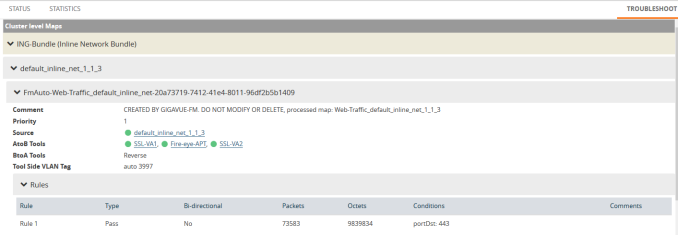
To troubleshoot any issue or failure in your flexible inline flow:
| 1. | From the flexible inline canvas, go to the Status tab to check the forwarding states of the required inline network. |
| 2. | Go to the Statistics tab to check the port statistics to ensure that there are no drops, errors, or discards. |
Note: Click the Statistics tab again to refresh the data.
| 3. | Go to the Troubleshoot tab to check the required map configurations and isolate the issue. |
For instructions on how to troubleshoot a specific issue, refer to Example: Troubleshoot Traffic Issues Between Side A and Side B.


