Dashboard
When you first login to GigaVUE‑FM, the Dashboard - Physical & Virtual page is displayed by default. You can navigate to Health Monitor Dashboards from the left navigation pane.
Table 1: Summary of Dashboard Navigation provides descriptions of the top navigation bar and the left navigation pane in GigaVUE‑FM.
|
Top Navigation Bar |
Left Navigation Pane |
|
Dashboard |
Physical & Virtual —Displays the informational widgets for the physical and Virtual nodes. |
|
Health Monitor—Displays information about GigaVUE‑FM such as CPU usage, amount of storage used and available. |
|
|
Profiles |
Allows you to create and view the profiles. A profile allows you to create a customized dashboard to monitor the physical and virtual nodes. |
Standalone UPN Dashboard
The Standalone UPN Dashboard provides visualizations of different statistics to validate the stable operation and performance of the Standalone UPN GsGroups. Also, you can configure the threshold value for the statistics and the GigaVUE‑FM raises events accordingly.
Types
-
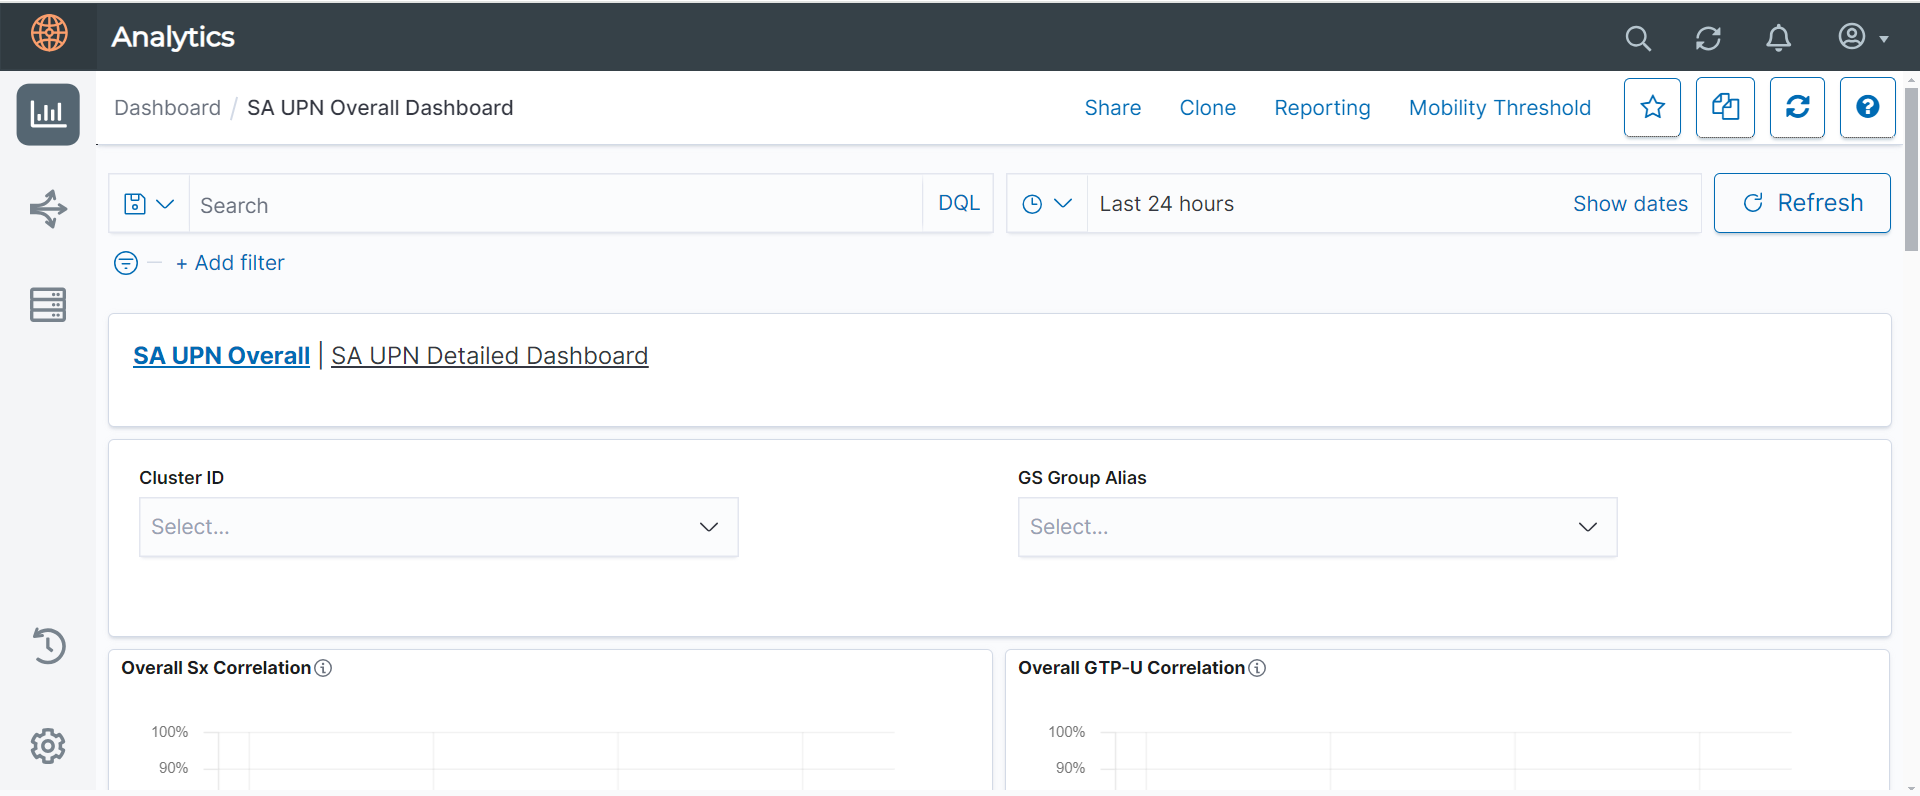
SA UPN Overall - This dashboard lists the top 10 performing GsGroups of a given metric.
-
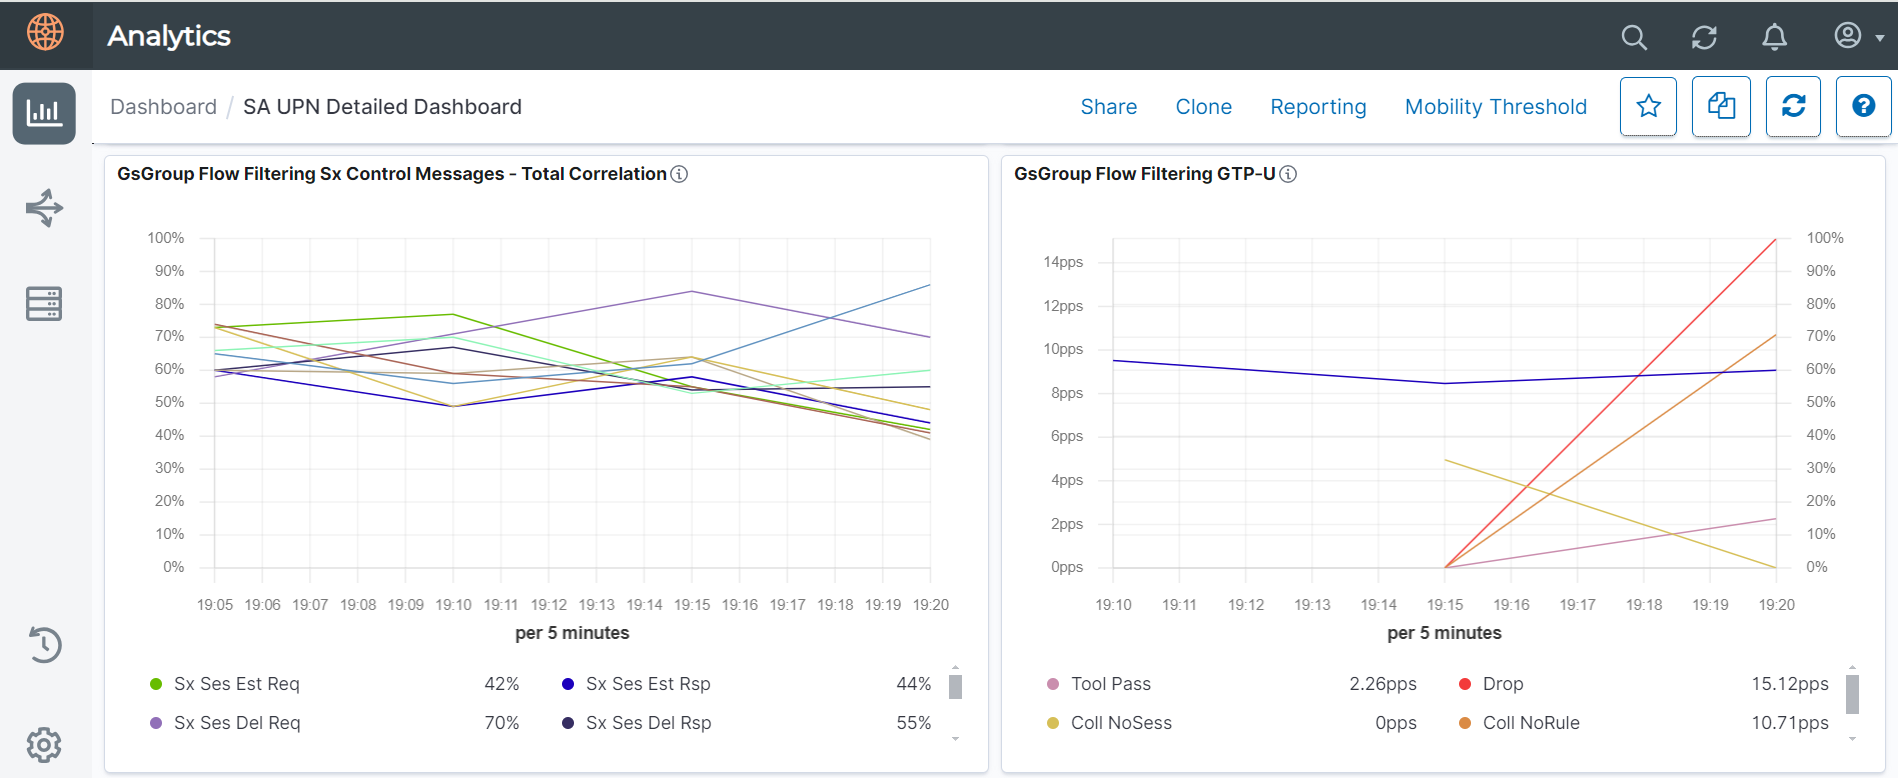
SA UPN Detailed Dashboard - This dashboard shows how a particular GsGroup is behaving.
Note: All the visualizations are applicable for software release version 6.6.00 and above.
List of Visualizations applicable for software release version 6.5.00
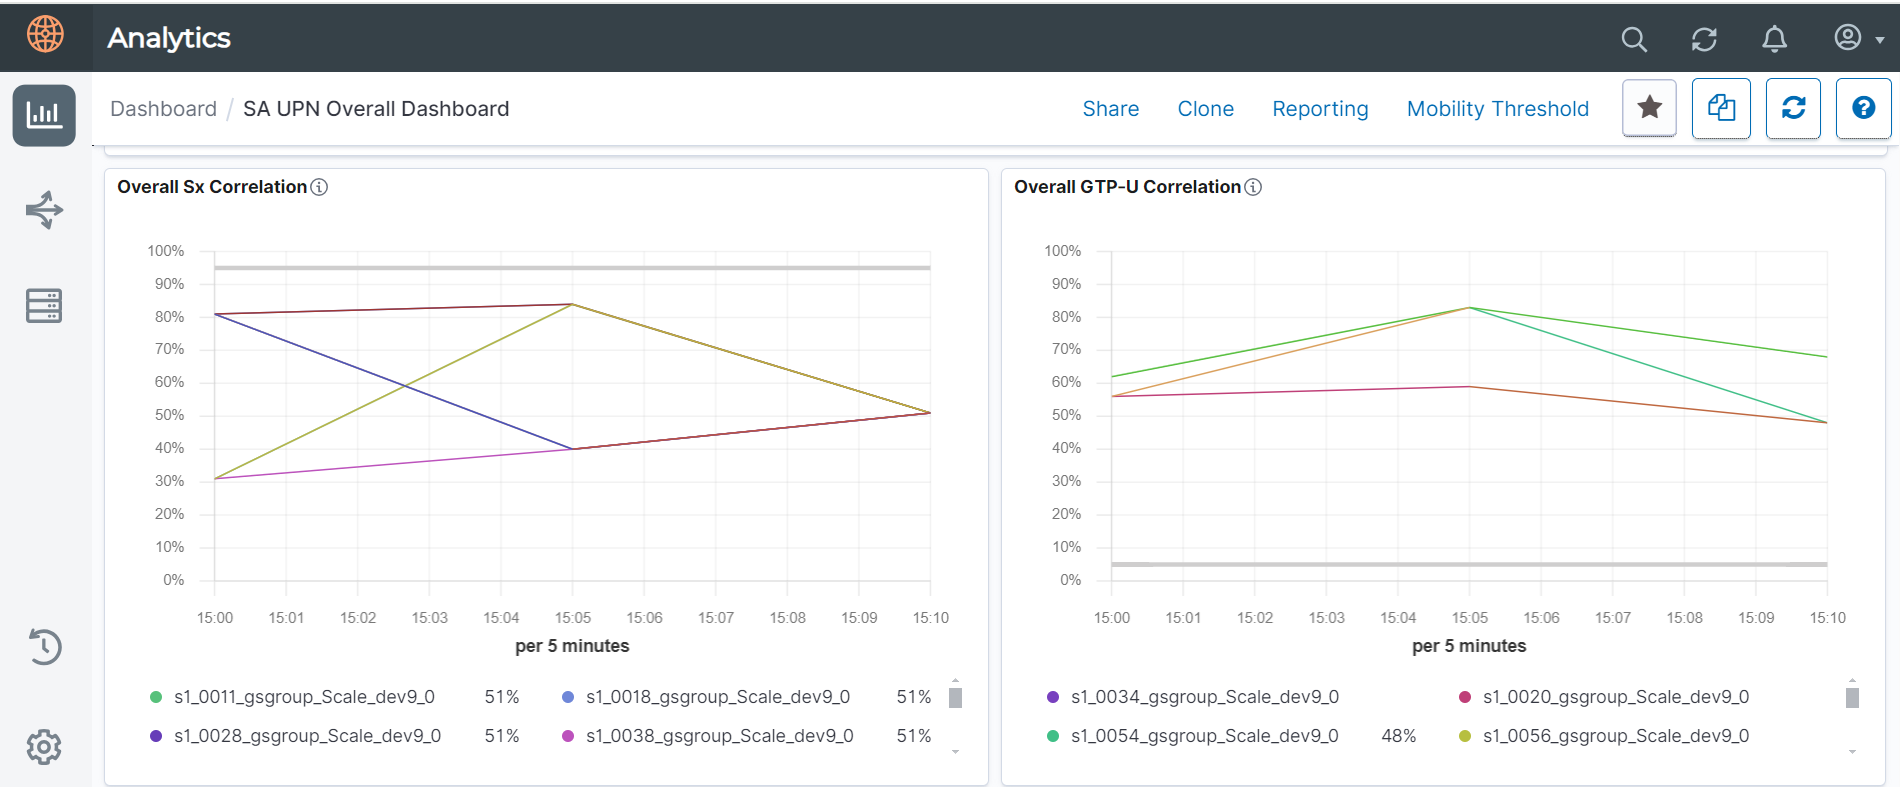
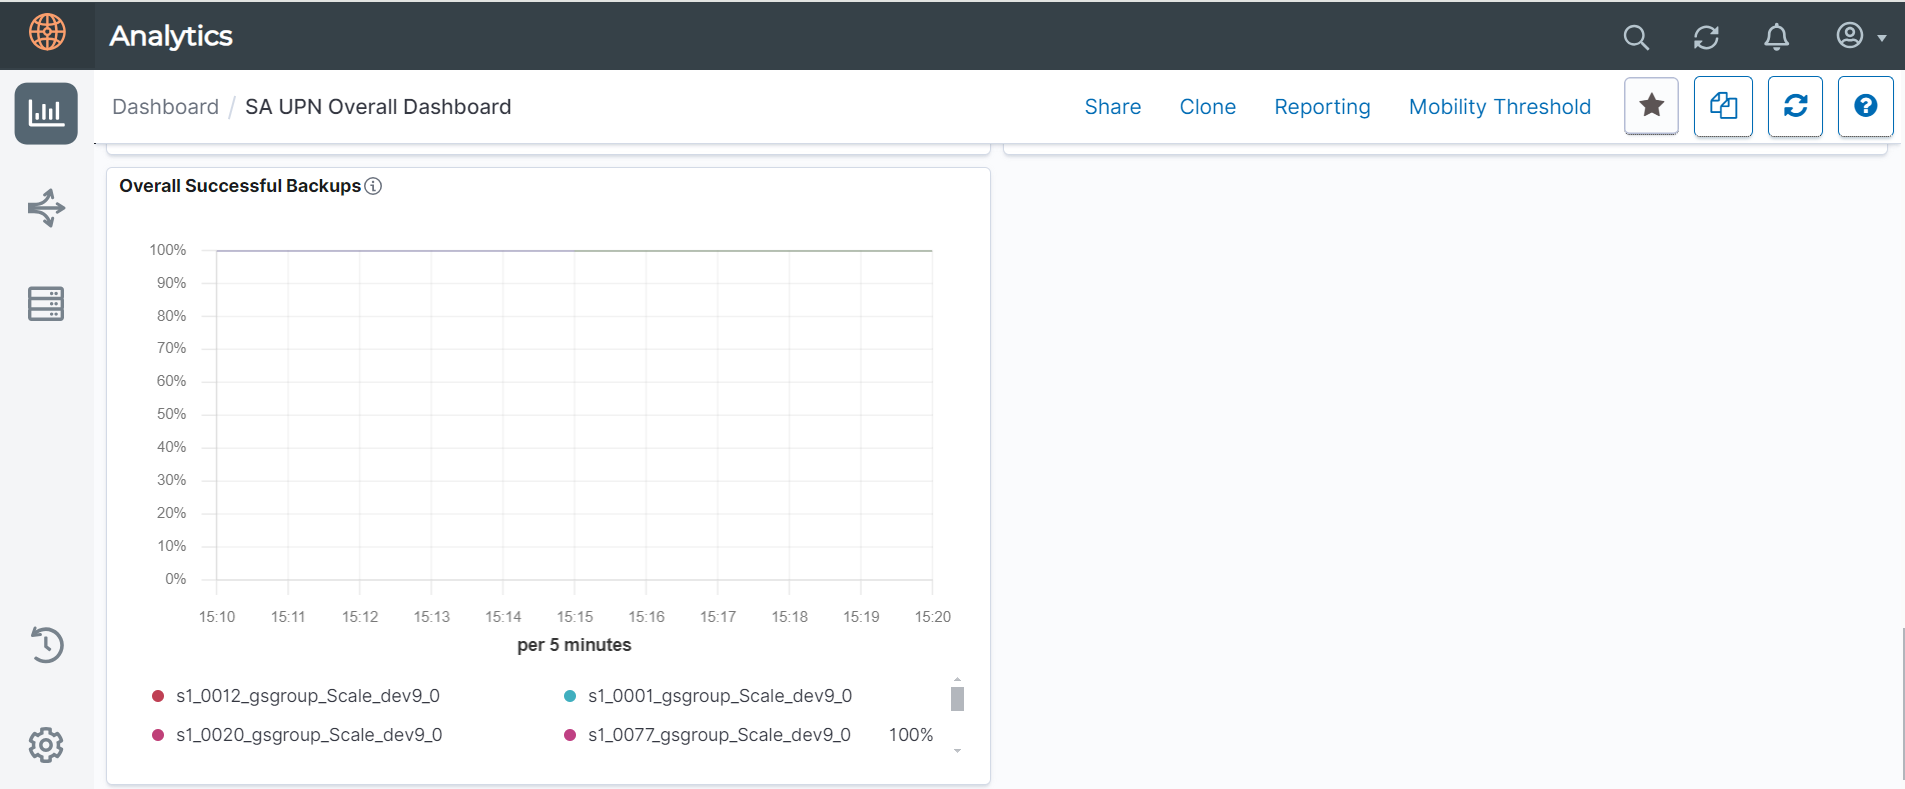
SA UPN Overall Dashboard
-
Overall Session Capacity
-
Overall Control Tunnels Session
-
Overall Successful Backups
-
Overall Xaui Drops
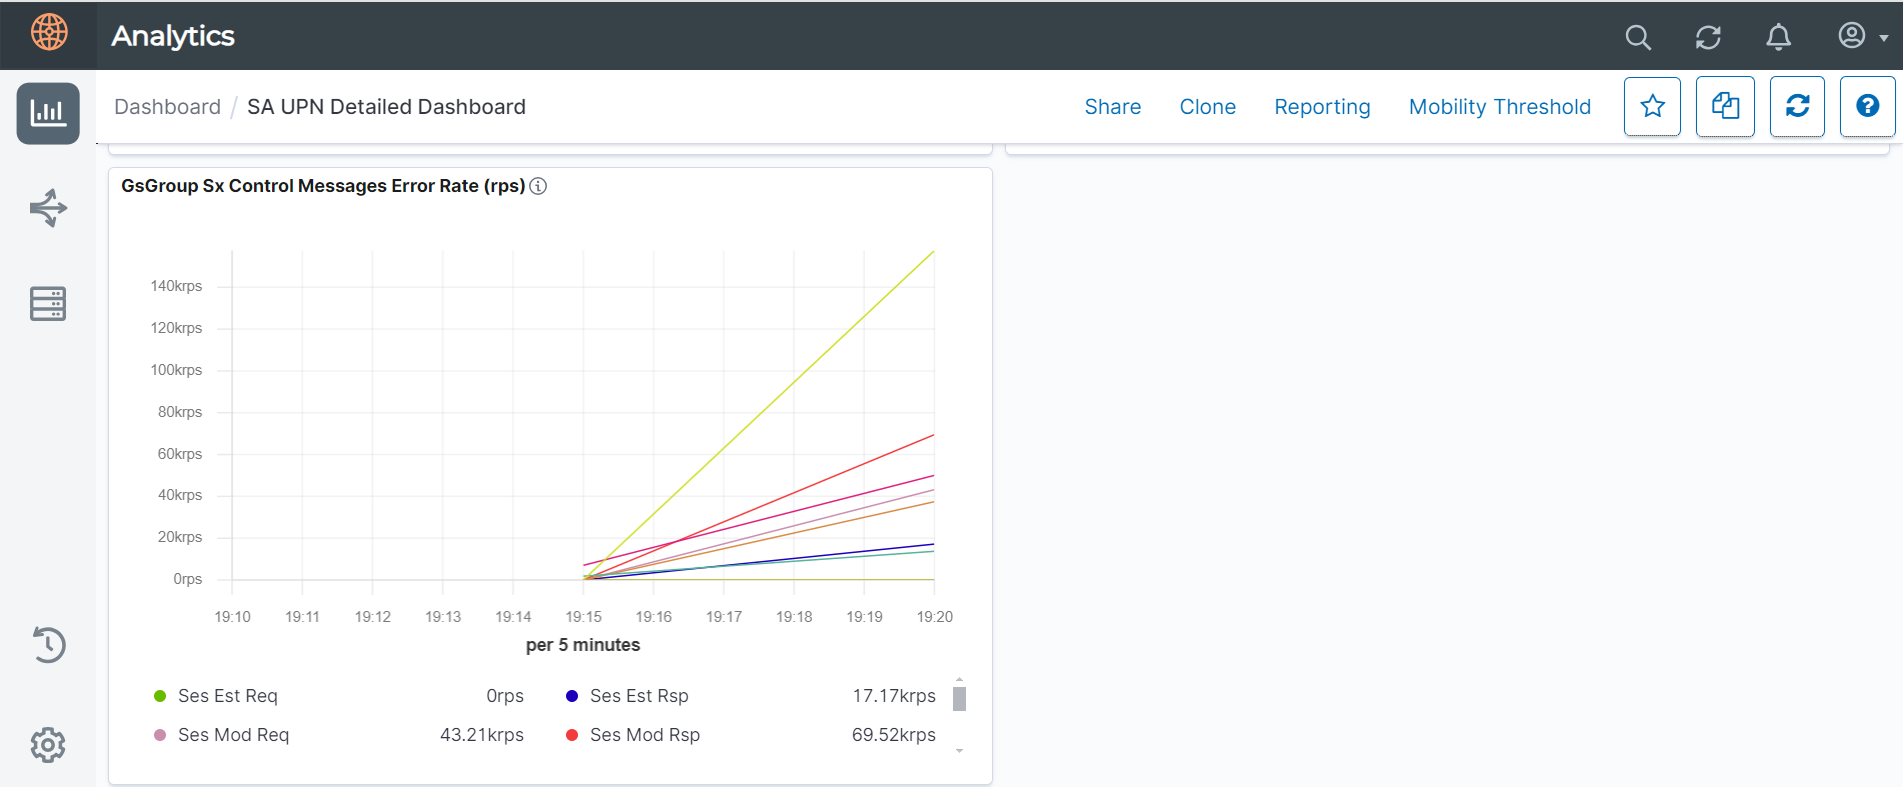
SA UPN Detailed Dashboard
-
GsGroup Flow Filtering Summary
-
GsGroup Stateful Session Recovery Backup
-
GsGroup Flow Filtering GTP-U
-
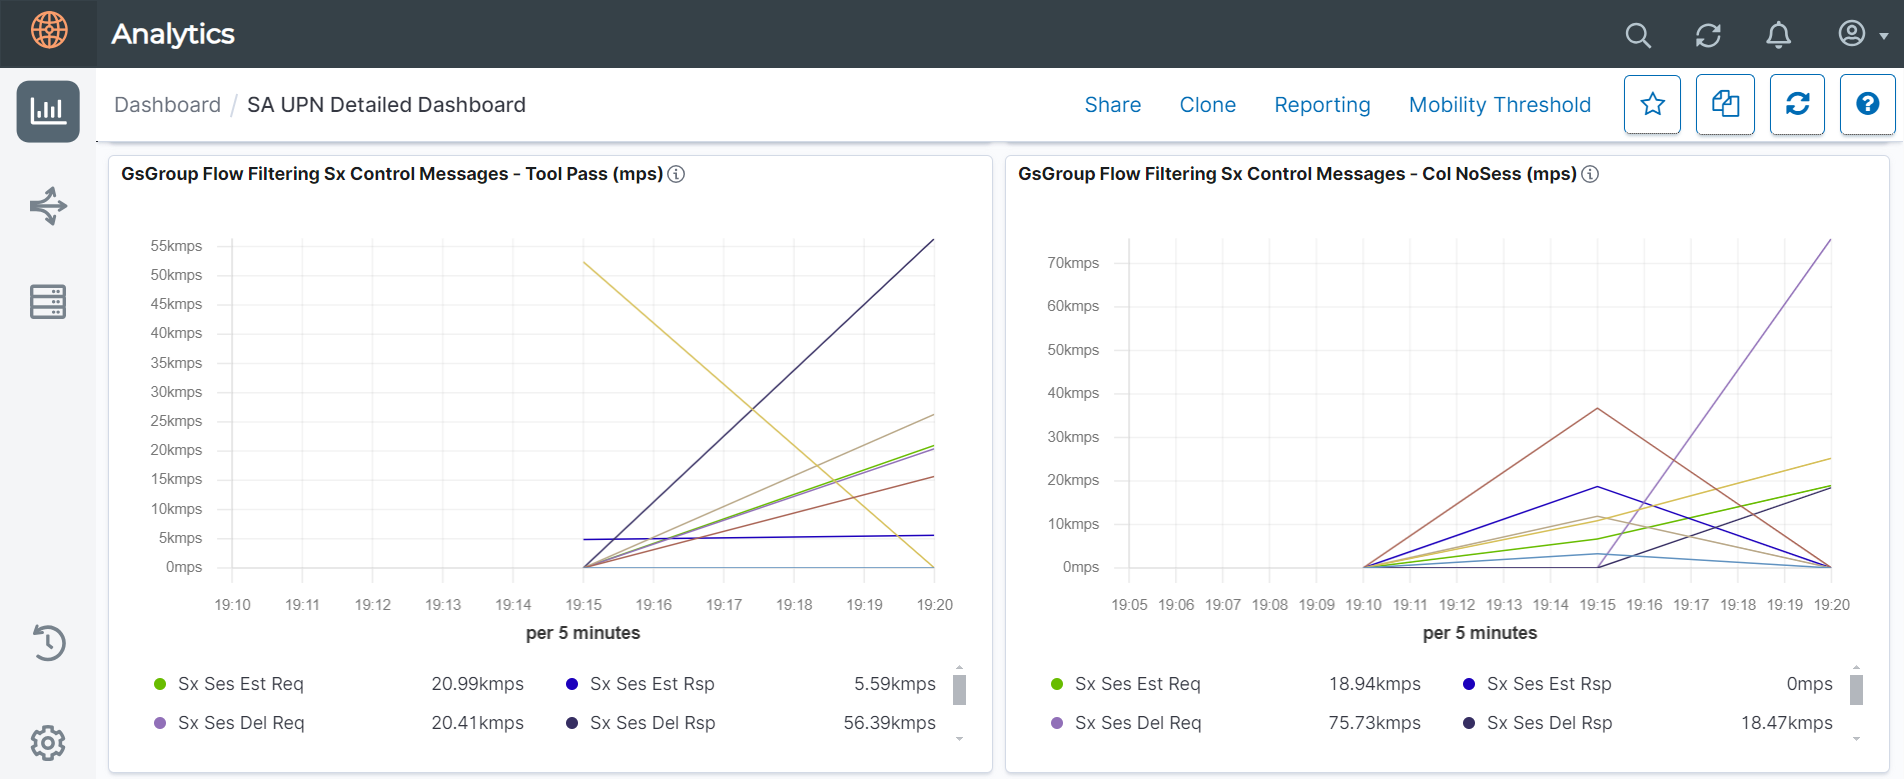
GsGroup Flow Filtering Sx Control Messages - Tool Pass
-
GsGroup Flow Filtering Sx Control Messages - Col NoSess
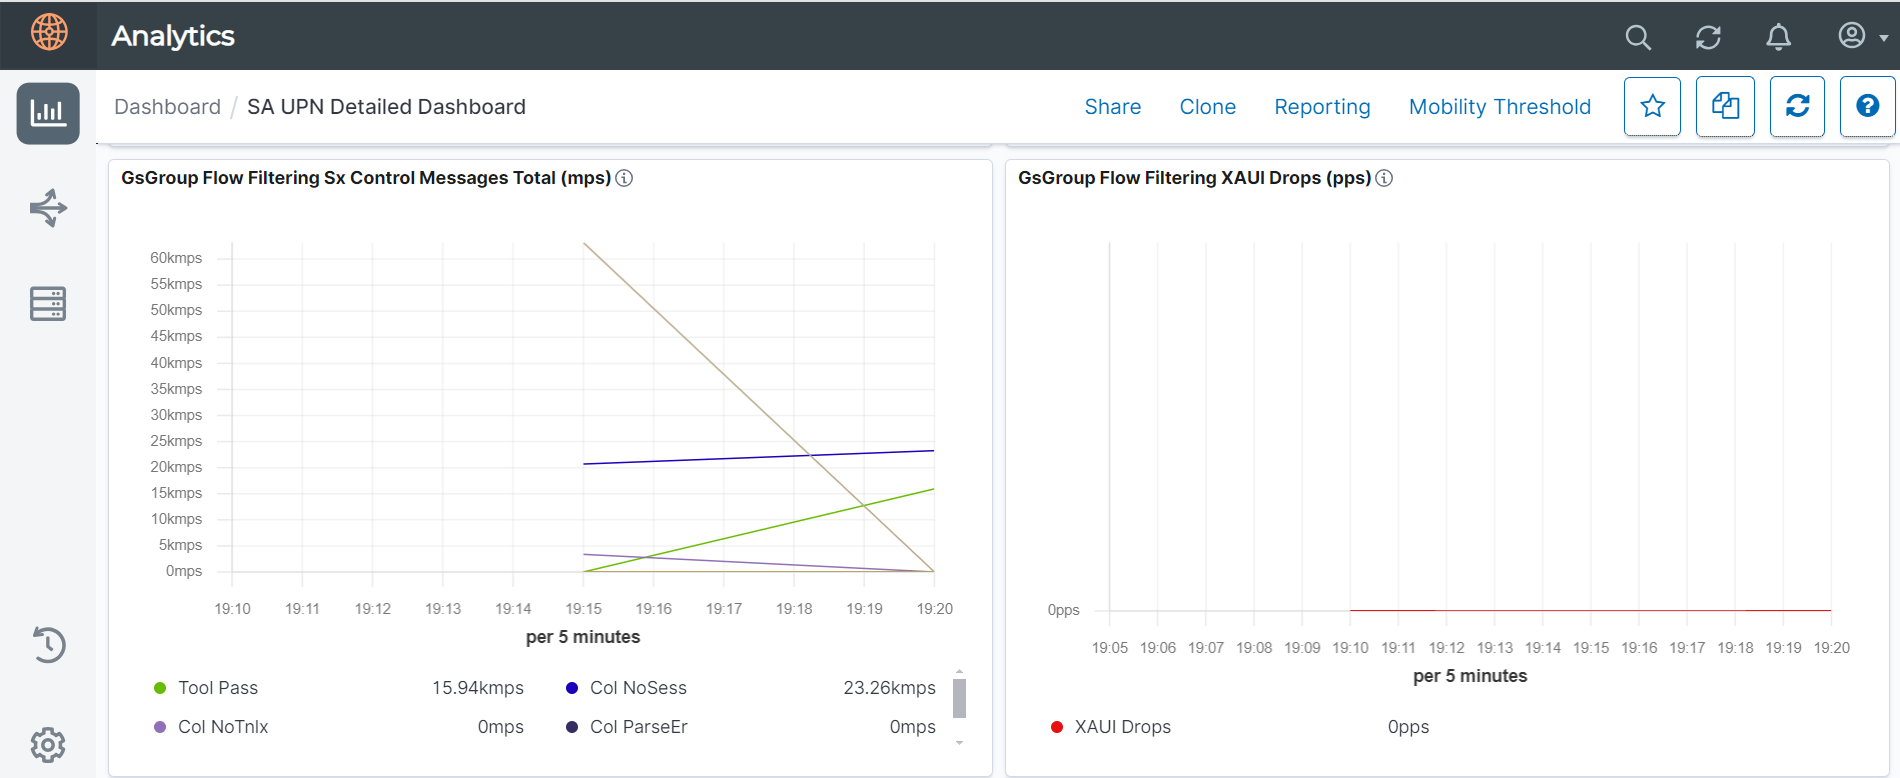
-
GsGroup Flow Filtering XAUI Drops
In the SA UPN Overall or SA UPN Detailed Dashboard, you can choose a cluster ID from the Cluster ID drop-down list and a GsGroup from the GsGroup Alias drop-down list to view the statistics of the selected GsGroup.
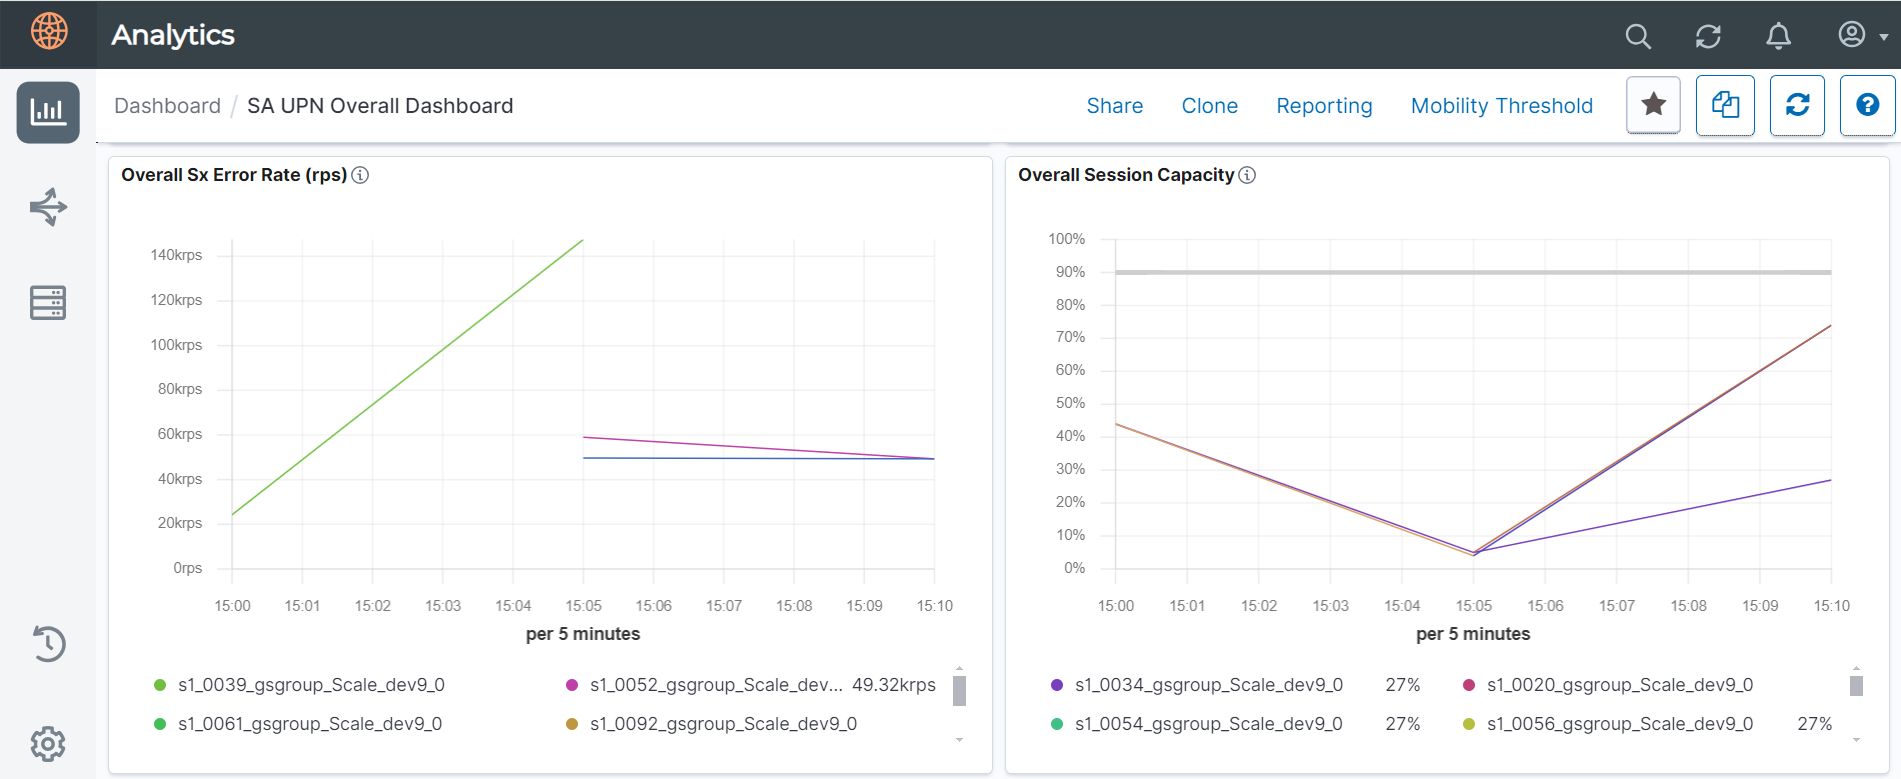
Note: The values of metrics GTP Correlation Percentage and Sx Correlation Percentage with decimals may not get rounded off to the accurate value.

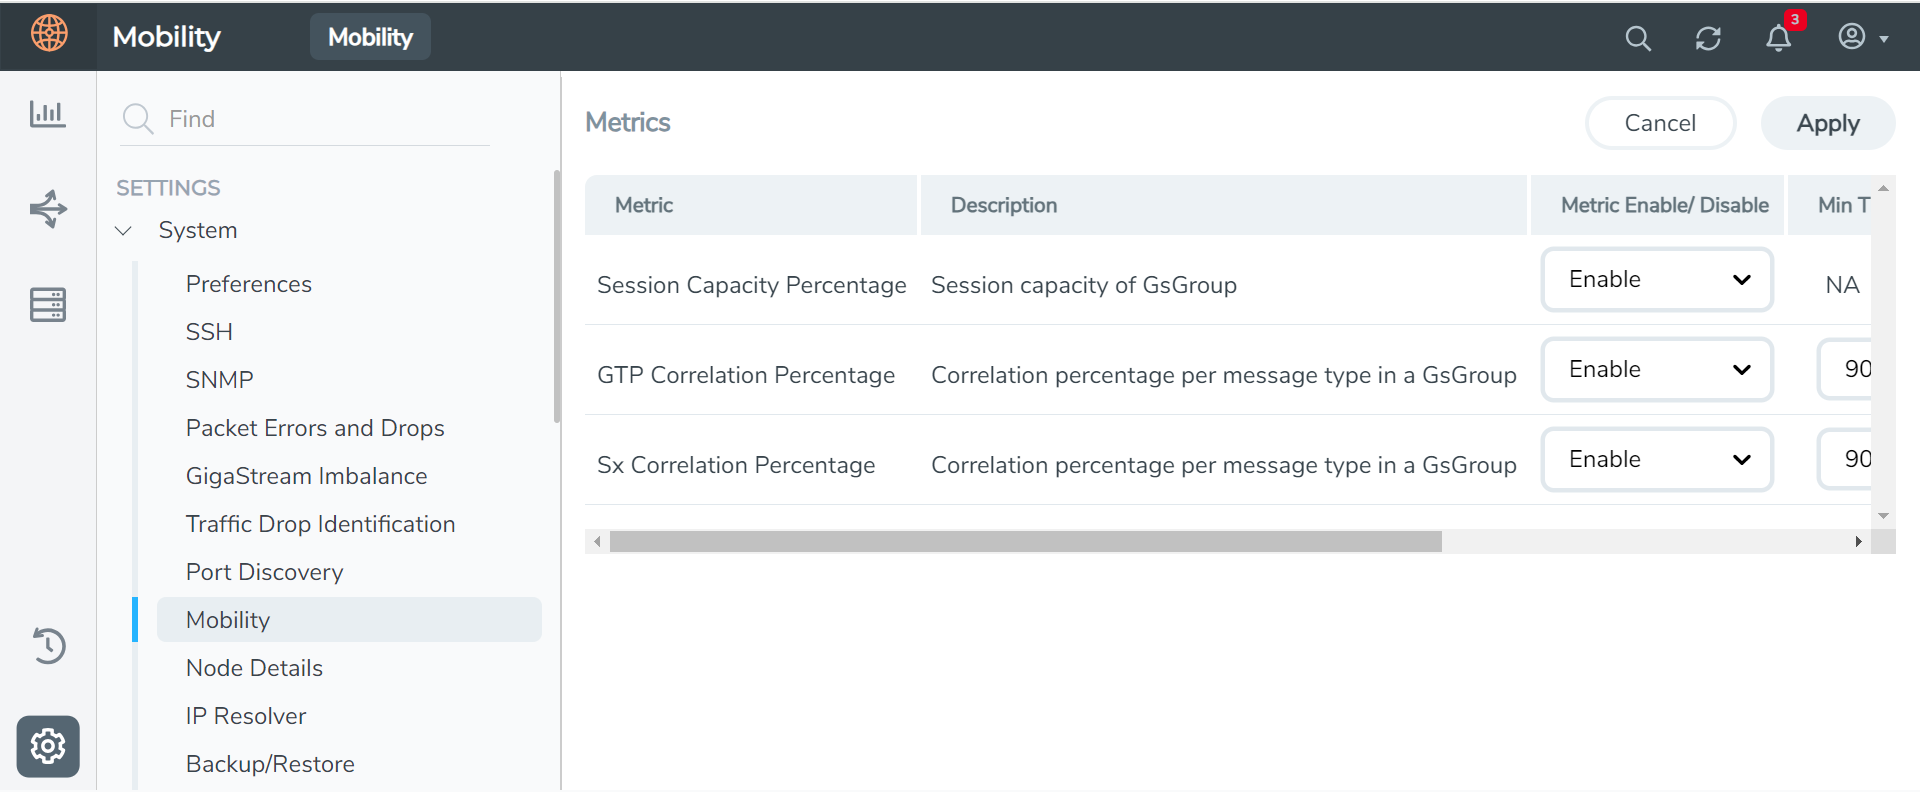
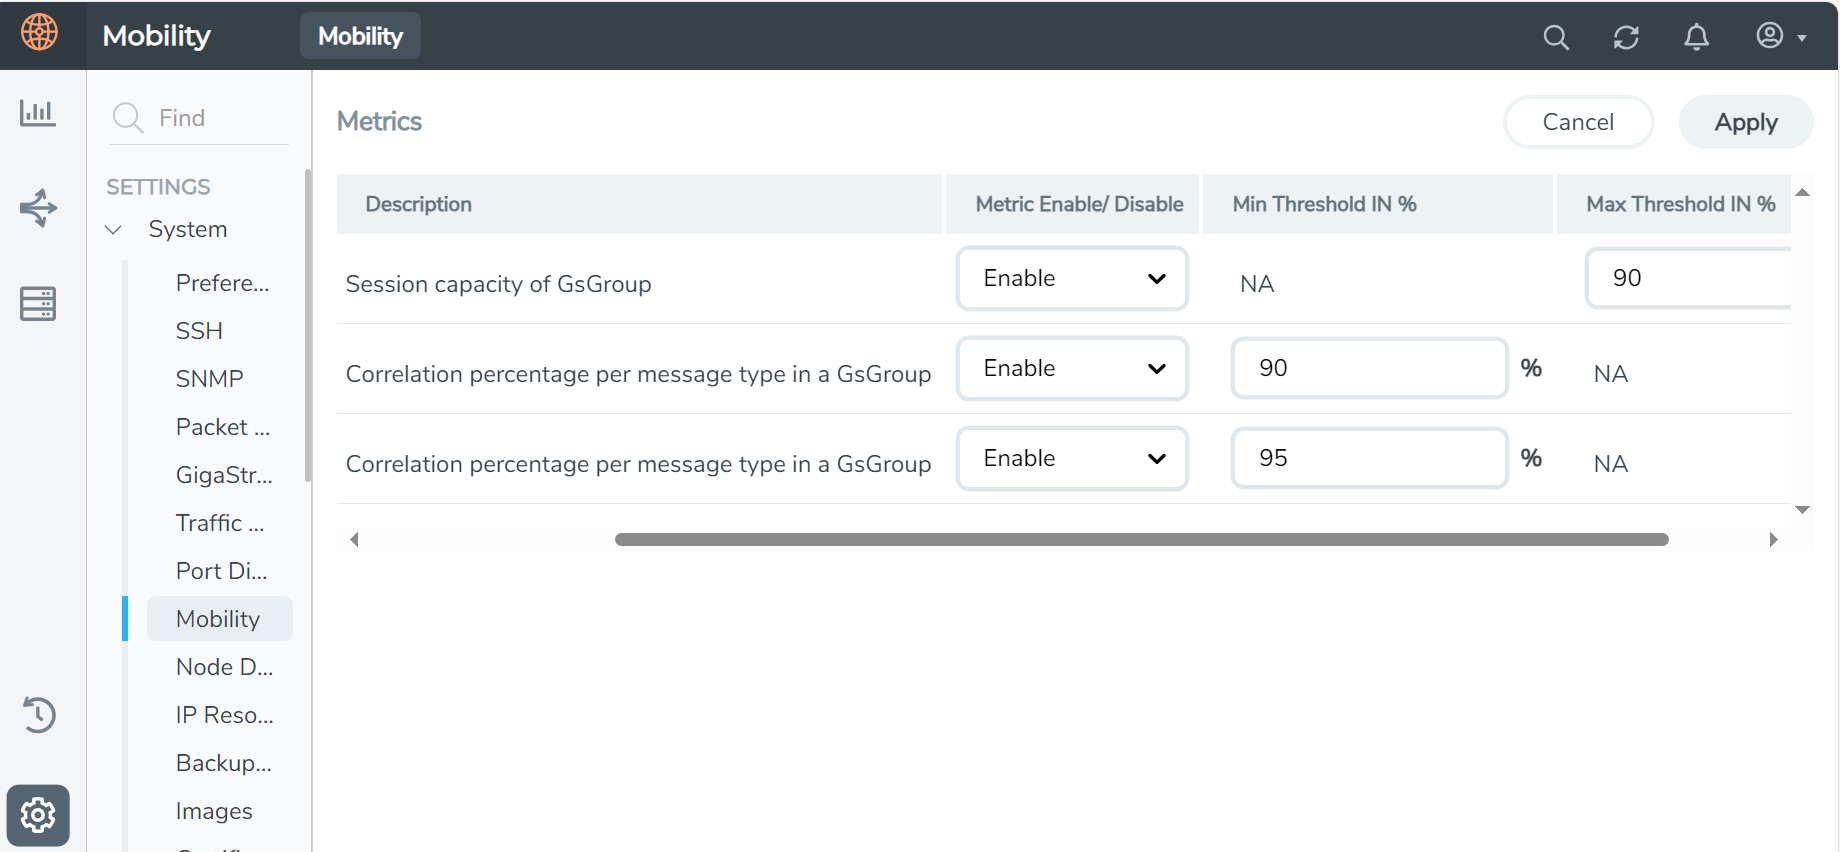
Threshold Configuration
You can configure the threshold values for the following metrics:
-
Session Capacity Percentage - Maximum threshold (between 0 and 100)
-
GTP Correlation Percentage - Minimum threshold (between 0 and 100)
-
Sx Correlation Percentage - Minimum threshold (between 0 and 100)
Note: The metrics GTP Correlation Percentage, Sx Correlation Percentage are applicable only for SA-UPN GsGroups. The metric Session Capacity Percentage is applicable for all the GsGroups.
Procedure to Configure Threshold
Step 1: Log into the GigaVUE‑FM
Step 2: Click Settings
Step 3: In the System drop drown menu, click Mobility
Note: You can also click the Mobility Threshold tab in the SA UPN Dashboard page to navigate to the metrics page.
Step 4: Select Enable in the Metric Enable/Disable column to configure threshold for the particular metric.
Step 5: Click Apply after configuring the metric. The message "Mobility Threshold Configurations updated successfully" appears.


