View the Health Status of a Solution
The health of an Application Intelligence solution is determined by the health status of the following components, and the configuration status during deployment of the solution in a device:
| IP interface |
| Source Port |
| Destination Port |
| GigaSMART Engine |
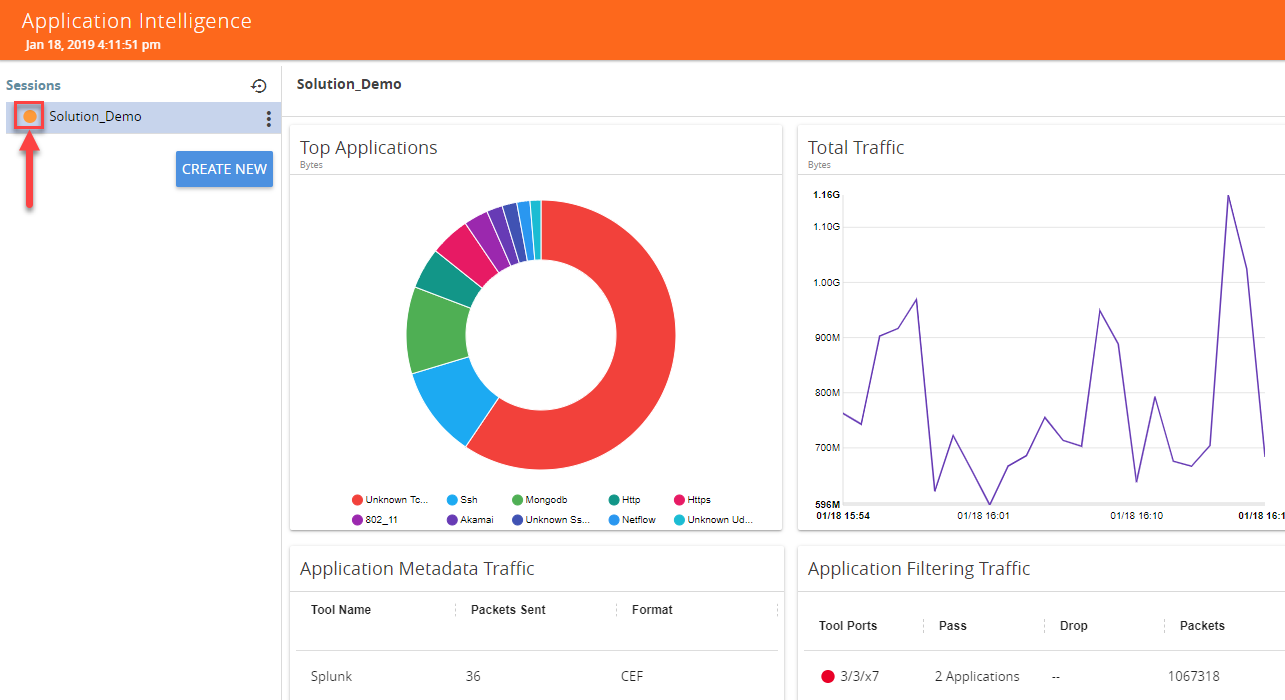
You can view the health status of the solution by a color indication next to the name of the solution as shown in the following figure:

The health status of a solution is indicated by the following colors:
|
Color |
Health Status of a Solution |
|
Green |
Healthy - All the components in a solution are functioning properly. |
|
Red |
Unhealthy - Any of the components in a solution is not functioning properly. |
|
Amber |
Partially Healthy |
You can also view the reason for a failover when you hover your mouse over the color indicator next to the name of the solution. To avoid this scenario:
- On the right side of the top navigation bar, click
 .
. - On the left navigation pane, select System > Thresholds.
- Set the threshold value of GigaSMART engine port packet drops to zero.
The following table provides the health state of the Application Intelligence solution corresponding to the health state of its associated components:
|
Health Status of a Solution |
GSGroup |
IP Interface |
Network Port and Tool Port |
Metadata Exporter |
Configuration Deployment Status |
|
Red |
Unhealthy |
Healthy |
Healthy |
Healthy |
Success |
|
Amber |
Partially Healthy |
Healthy |
Healthy |
Healthy |
Success |
|
Red |
Healthy |
Unhealthy |
Healthy |
Healthy |
Success |
|
Amber |
Healthy |
Partially Healthy |
Healthy |
Healthy |
Success |
|
Amber |
Healthy |
Healthy |
Some Maps are Unhealthy/Partially Healthy |
Healthy |
Success |
|
Red |
Healthy |
Healthy |
All Maps are Unhealthy |
Healthy |
Success |
|
Red |
Healthy |
Healthy |
Healthy |
All Metadata Exporters are Unhealthy |
Success |
|
Amber |
Healthy |
Healthy |
Partially Unhealthy |
Healthy |
Success |
|
Amber |
Healthy |
Healthy |
Healthy |
Some metadata exporters are Unhealthy |
Success |
|
Red |
Healthy |
Healthy |
Healthy |
Healthy |
Failed |
|
Amber |
Healthy |
Healthy |
Healthy |
Healthy |
Partial Success |
|
Red |
Healthy |
Healthy |
Healthy |
Healthy |
Failed |
|
Green |
Healthy |
Healthy |
Healthy |
Healthy |
Success |
To view the details of a solution, click View Details > Troubleshoot. For more details, refer to View the Details of an Application Intelligence Session.

The solution page provides you the details of the health status of its associated components.


