Configure Application Metadata Exporter Application
To add the AMX application:
- Drag and drop Application Metadata Exporter from APPLICATIONS to the graphical workspace. The Application quick view appears.
- Enter the Alias for the application. Enter a port number for the Cloud Tool Ingestor Port.
- Click the Add button for Cloud Tool Exports or Kafka.
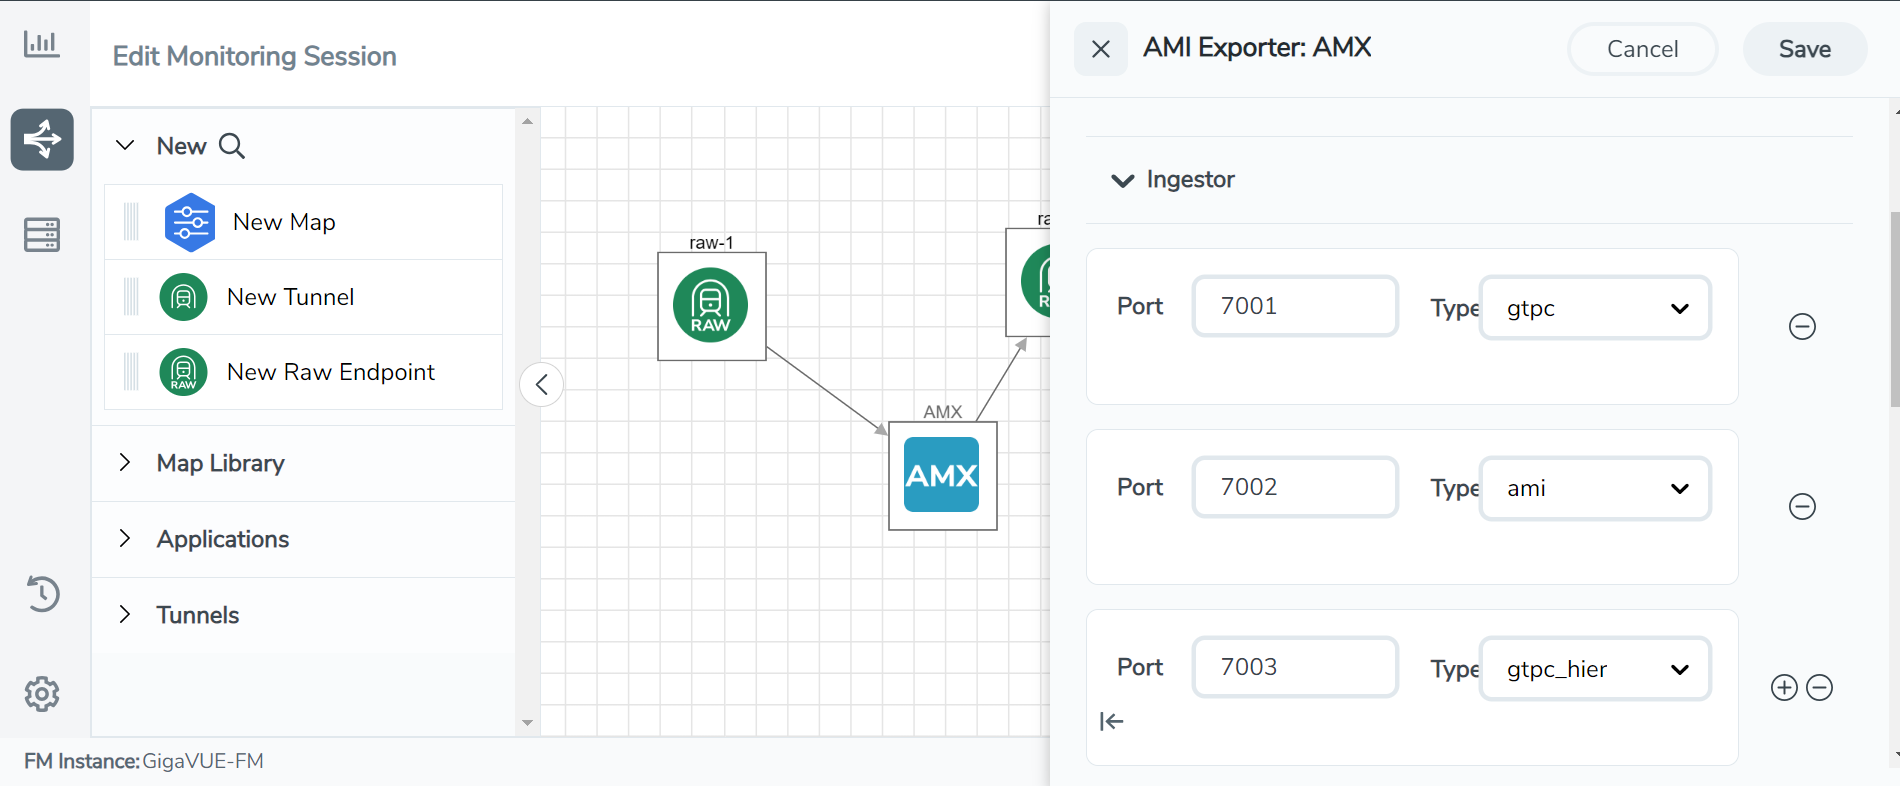
- Drag and drop Application Metadata Exporter from APPLICATIONS to the graphical workspace. The Application quick view appears.
- Enter the Alias for the application.
- In the Ingestor section, enter a port number for the Port field and select ami or gtpc or gtpc_hier for the Type field.
- Export your Application Metadata Intelligence output or control plane metadata to either cloud tools or Kafka.
- Enter the following details for the Cloud tool export in the Application quick view:
Fields
Description
Alias
Enter the alias name for the cloud tool export.
Cloud Tool
Select the Cloud tool from the drop-down menu.
Type Select ami for exporting AMI or gtpc for exporting control plane metadata. Account ID
Enter the account ID number of the selected Cloud Tool.
API Key
Enter the API key of the Cloud Tool.
Enable Export
Enable the box to export the Application Metadata Intelligence output in JSON format.
Zip
Enable the box to compress the output file.
Note: Enable this field when using New Relic as the cloud tool.
Interval
The time interval (in seconds) to upload data periodically.
Recommendation
Minimum: 10 seconds
Maximum: 1800 seconds.
Parallel Writer
Specifies the number of simultaneous JSON exports done.
Export Retries
The number of times the application tries to export the entries to the Cloud Tool.
Recommendation
Minimum value: 4
Maximum value: 10
Maximum Entries
The number of JSON entries in a file.
Maximum Value: 5000
Minimum Value: 10
Default Value: 1000
Labels
Click Add and perform the following details:
o Enter the Key . o Enter the Value. Note: When New Relic is selected as the cloud tool, the key is automatically set as is eventType and the Value can only have alphanumeric characters, colons ( : ), periods ( . ), and underscores ( _ ).
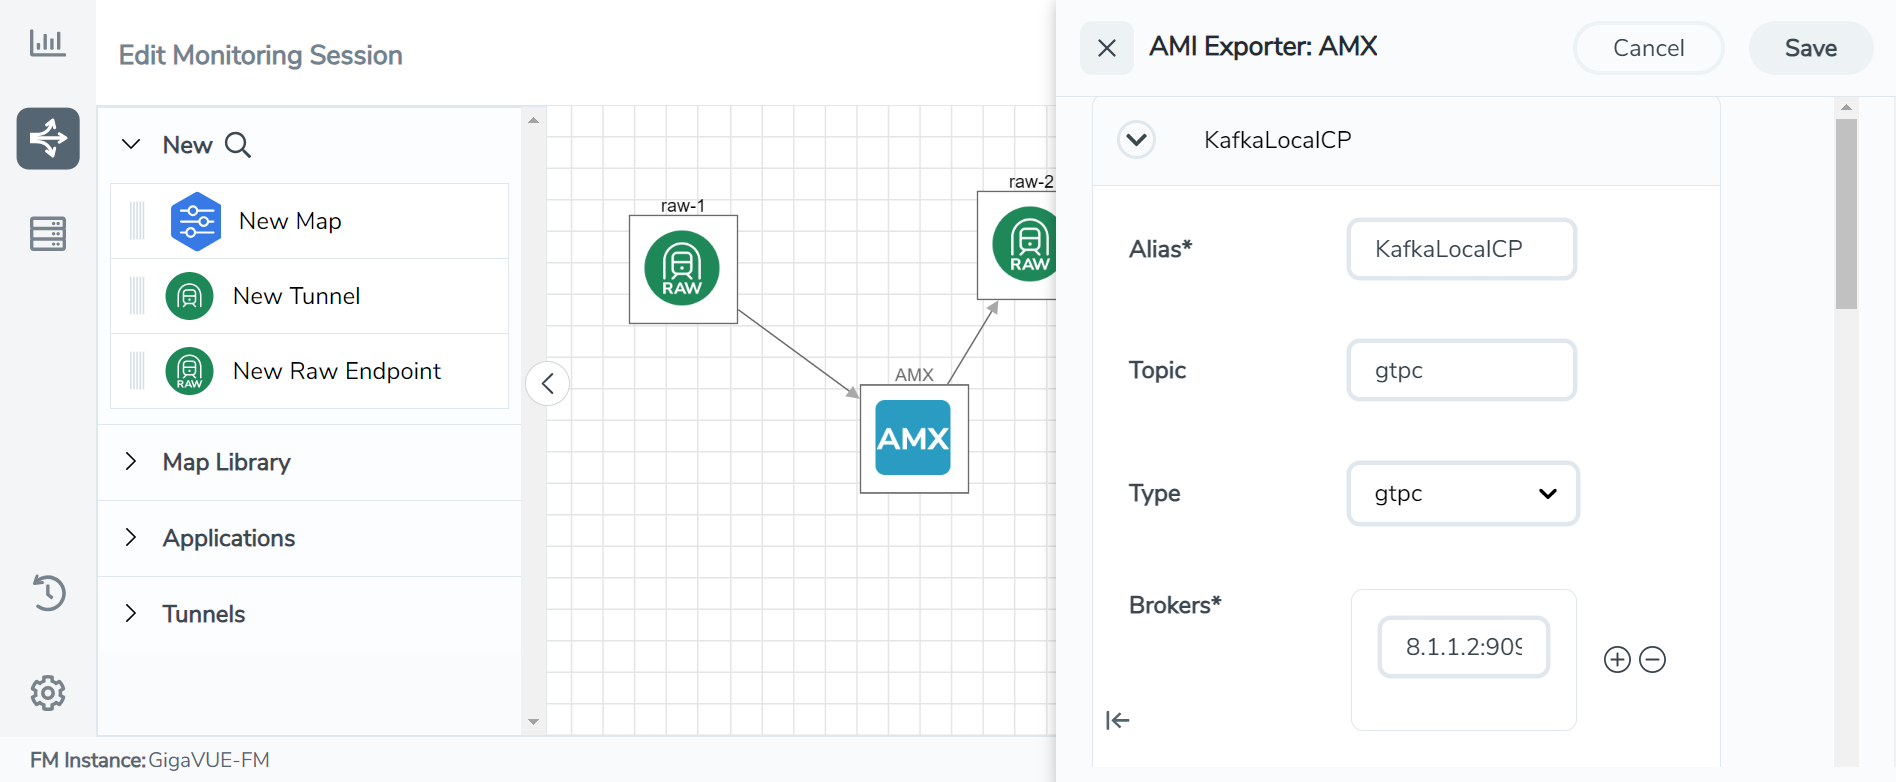
Enter the following details for Kafka export in the Application quick view:
Fields
Description
Alias
Enter the alias name for the Kafka Export.
Topic
The topic name to push JSON streams to, which is generally given to users part of the Kafka administration. Type Select ami for exporting AMI or gtpc for exporting control plane metadata. Brokers
The URL that contains the Kafka cluster endpoints. Click  to add another broker and click
  to remove an existing broker.
Enable Export
Enable the box to export the Application Metadata Intelligence output in JSON format.
Zip
Enable the box to compress the output file.
Interval
The time interval (in seconds) to periodically upload the data.
Recommendation
Minimum: 10 seconds
Maximum: 800 seconds
Default: 30 seconds
Parallel Writer
Specifies the number of simultaneous JSON exports done.
Export Retries
The number of times the application tries to export the entries to Kafka.
Recommendation
Minimum value: 4
Maximum value: 10.
Maximum Entries
The number of JSON entries in a file.
Maximum: 5000
Minimum: 10
Default: 1000
Labels
Click Add and perform the following:
o Enter the Key. o Enter the Value. Producer Configurations Click Add to enter the authentication details if a Kafka broker needs authentication.
For Example:
- security.protocol=SASL_SSL
- sasl.mechanism=PLAIN
- sasl.username=username
- sasl.password=password
- Click Deploy.
- From the Select nodes to deploy the Monitoring Session dialog box, select the desired GigaVUE V Series Node to deploy the monitoring session.
- From the drop-down menu, select the interfaces for the REPs deployed in the monitoring session.
- Click Deploy.
Note: If you reload the GigaVUE V Series Node after configuring the AMX application, then the Ingestor in the AMX application fails.
You can view the configuration health status on the Monitoring Session page. For details, refer to Cloud Health Monitoring - Configuration Health Monitoring.
To view the application statistics on the Monitoring Session Statistics page, click View Monitoring Session Diagram and click on the AMX application. The Statistics appear as a quick view page. To view the exporter related statistics, select Exporter from the top navigation button on the quick view page.


