View Monitoring Session Statistics
View Monitoring Session Statistics
The OVERVIEW page of Monitoring Session allows you to analyze the incoming and outgoing traffic across multiple time intervals. For example, hourly, daily, weekly, and monthly.
You can view the high-level information of the selected Monitoring Session such as:
-
Statistics
-
Connections
-
V Series Nodes
-
Source Health
-
Http2 Logging
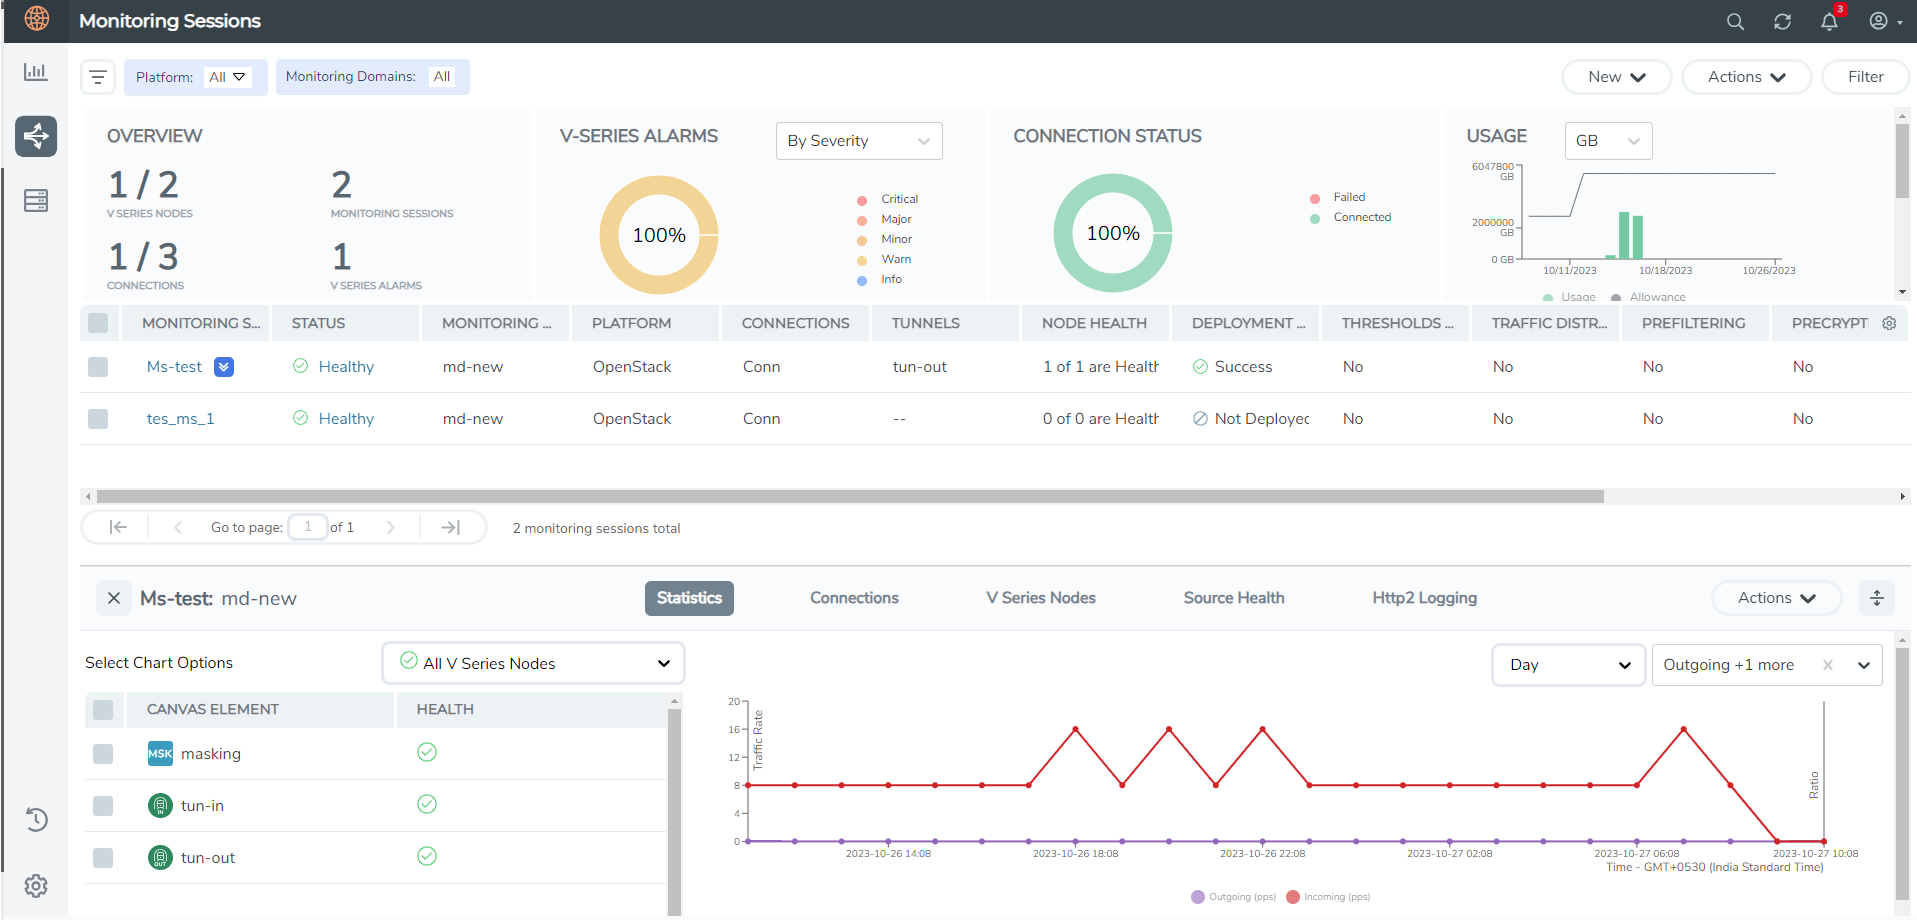
To know more about the statistics of the session, click Statistics.
View Statistics with Multiple Filters
You can apply different filters per the data analysis requirements to view the statistics.
GigaVUE‑FM allows you to perform the following actions on the Monitoring Session Statistics page:
-
Full Screen View: To view in full screen, click the Actions drop-down list at the right corner of the window, and select Full Screen. Statistics appear in full screen.
-
Time Interval Options: You can view the incoming and outgoing traffic on an hourly, daily, weekly, and monthly basis. You can select the options from the drop-down list box.
-
View with Traffic Data: You can filter the traffic and view the statistics based on factors such as Incoming, Outgoing, Ratio (Out/In), Incoming Packets, Outgoing Packets, Ratio (Out/In) Packets. You can select the options from the drop-down list box.
-
Per-Node Statistics: You can also view the statistics of the monitoring session deployed in the individual V Series Nodes. To view the statistics of the particular V Series Node, select the name of the V Series Node from the drop-down list for which you want to view the statistics.
-
Element-Level Insights: You can view the statistics of the elements involved in the monitoring session. To view the statistics, click on the Select Chart Options page and select the elements associated with the session. Directly on the graph, you can click on Incoming(Mbps), Outgoing (Mbps), or Ratio (Out/In) (Mbps) to view the statistics individually.


