Configure Application Intelligence Session
Application Intelligence provides a comprehensive solution that:
|
■
|
identifies the applications contributing to the network traffic. |
|
■
|
isolates preferred application-specific traffic and directs it to the appropriate tools. |
|
■
|
exports relevant application metadata for further analytics and analysis. |
Application Intelligence provides the following capabilities for both physical devices and virtual nodes:
|
■
|
Application Visualization (earlier known as Application Monitoring) - Identifies and monitors all applications contributing to the network traffic, and reports on the total applications and the total bandwidth they consume over a select period. Able to identify more than 3,200 applications. It displays the traffic statistics in bytes, packet and flows. |
|
■
|
Application Filtering Intelligence- Enables traffic filtering by layer 7 applications, which means you can filter out high-volume, low-risk traffic from reaching the tools and distribute high-risk network traffic of interest to the right tool at the right time. |
|
■
|
Application Metadata Intelligence - Supports exporting over 5000 attributes of metadata that provide relevant usage context on over 3,200 applications, thus enabling you to rapidly identify indicators of compromise (IoC) for security analytics and forensics tools. |
Prerequisites
- The environment on which the Application Intelligence solution is to be deployed must already be created and the nodes must be deployed on it.
- In virtual environment, the destination tunnels for the Application Filtering Intelligence Map must already be created.
Note: For Application Visualization and Application Metadata Intelligence, the destination(s) are defined internally by the solution.
Create an Application Intelligence Session in Virtual Environment
To create an Application Intelligence Session:
|
1.
|
On the left navigation pane, select Traffic > Solutions >Application Intelligence. |
|
2.
|
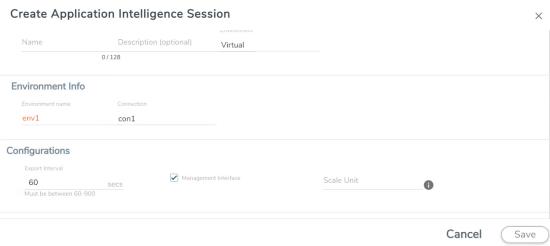
Click Create New. The Create Application Intelligence Session page appears.
 |
|
3.
|
In the Basic Info section, enter the name and description, and in the Environment select Virtual for the session to be created: |
|
■
|
Virtual- connects to the specific environment. |
|
4.
|
In the Environment section, select the Environment Name, and the Connection Name. To create an Environment and connection, refer to Configure Environment section in the respective cloud guides.. |
|
5.
|
In the Configurations section, complete the following: |
|
a.
|
Select an Export Interval during which you want the Application Intelligence session to generate the reports for application visualization. The valid range is 60–900 seconds. |
|
b.
|
Select the required interface. By default, Management Interface is enabled. To export the data through tunnel interface, uncheck the Management Interface check box. |
|
c.
|
Enter a value for the Scale Unit. The scale unit represents the number of flows supported by the application. If the scale unit value is 1, the maximum active flow limit will be 100k.
Refer to the following table for the maximum scale unit supported for VMware, AWS Nutanix, and Azure platforms.
| Cloud Platform | Instance Size | Maximum Scale Unit |
|---|
| Secure Tunnel Disabled | Secure Tunnel Enabled |
|---|
VMware | Large (8 vCPU and 16 GB RAM) | 3 | 2 | AWS | Large (c5n.2xlarge) | 4 | 3 | Medium (t3a.xlarge) | 3 | 1 | Azure | Large (Standard_D8s_V4) | 9 | 5 | Medium (Standard_D4s_v4) | 3 | 1 | Nutanix | Large (8 vCPU and 16 GB RAM) | 3 | 2 |
|
Note: If the Application Intelligence Session deployment fails, due to using a scale unit other than the recommended scale unit, then reload the GigaVUE V Series Node.
|
6.
|
In the Source Traffic section, select anyone of the following: |
|
■
|
Source Selector‑ Select the source from the drop-down list box. To create new source, select New Source Selector and add the filters. For more information on creating a New Source Selector, refer to Create Source Selectors. |
|
■
|
Prefilter - Enable the mirroring option, select the prefilter checkbox and then select the policy. If you want to enable Secure tunnel, then select the secure tunnel checkbox. |
|
■
|
Precryption: Select the Precryption checkbox and then select the policy. If you want to enable Secure tunnel, then select the secure tunnel checkbox. |
Note: You cannot configure Source Selectors when you deploy the GigaVUE V Series Nodes using the Third Party Orchestration in VMware ESXi host.
|
■
|
Tunnel Specification- Select the tunnel from the drop-down list box. To create new tunnel, select New Source Tunnel Spec and add the details for the tunnel. For more information on creating a new tunnel, refer to Create Tunnel Specifications. |
Note: Select the ens192 interface for the Tunnel Specifications from the drop-down menu when using third party orchestration.
|
■
|
Raw End Point- Select the Raw End Point Interface from the drop-down menu which will trap the traffic for application monitoring. |
Note: This field is applicable only when you deploy your GigaVUE V Series Nodes using third party orchestration in VMware ESXi Host, Nutanix and Google Cloud Platform.
- Tunnel Specification for the source must always be configured with Traffic Direction as IN, to indicate that it is an ingress tunnel.
- For Azure Connection, VXLAN is the only supported Tunnel Type.
|
7.
|
Click Save. The session created is added in the list view. |
|
8.
|
In the User Defined Applications section, select the template from the list.For information on Supported protocols and Attributes and Limitations refer User Defined Application topic. |
The total applications participating in the network traffic are displayed in the Application Intelligence Dashboard. For more information about the dashboard, refer to the View the Application Intelligence Dashboard.
Select the session from the Application Intelligence Sessions pane and click on the  icon and select View Details from the drop-down menu, to view the deployed UCT-V, their status and more information about source selectors, selected target.
If the session configuration is unsuccessful, troubleshoot the error notified (refer to
View the Health Status of a Solution). Click the Reapply all pending solutions button  in the dashboard to redeploy the configuration.
Note: GigaVUE-FM takes few minutes to display the application statistics.
Note: The option Reapply all pending solutions is applicable for physical solution only.
When the Application Intelligence solution is in suspended state, you cannot delete the session. You can click on the icon and select View Details from the drop-down menu, to view the details.
You can also filter the traffic based on the applications. For more information, see Application Filtering Intelligence.


