Application Intelligence Session
Application Visualization (earlier known as Application Monitoring) gathers the application statistics, and sends this information to GigaVUE-FM, which acts as an application monitor. The monitoring reports are sent to GigaVUE-FM through the destination port 2056. The application statistics appear as an array of monitoring reports that provide application-usage data in an easy-to-read graphical interface. This provides you with greater insight and control over how your network is being used and what applications are utilizing the most resources. To perform Application Monitoring, you must create the required application intelligence sessions on the nodes managed by GigaVUE-FM.
GigaVUE-FM allows you to create Application Session for the following two environments:
Prerequisites
- The environment on which the Application Intelligence solution is to be deployed must already be created and the nodes must be deployed on it.
- In virtual environment, the destination tunnels for the Application Filtering Intelligence Map must already be created.
Note: For Application Visualization and Application Metadata Intelligence, the destination(s) are defined internally by the solution.
 Create an Application Intelligence Session in Physical Environment
To create an Application Intelligence Session:
|
1.
|
On the left navigation pane, select Traffic > Solutions > Application Intelligence. |
|
2.
|
Click Create New. The Create Application Intelligence Session page appears. |
Note: If the Create button is disabled, check whether a valid license for Application Metadata Intelligence or Application Filtering Intelligence is available.
|
3.
|
In the Basic Info section complete the following: |
|
■
|
Enter the name and description (optional). |
|
■
|
Select Physical in the Environment field. |
|
■
|
Select the node from the list of nodes. |
|
4.
|
In the Configurations section, complete the following: |
|
a.
|
Select an export interval during which you want the Application Intelligence session to generate the reports for application monitoring. The valid range is 60–900 seconds. |
|
b.
|
Select a GigaSMART Group. You can also choose to create a new GigaSMART Group. |
|
•
|
Provide a name in the Alias field. |
|
•
|
Select a port or multiple ports from the Port List. |
For more information about creating a new GigaSMART group, refer to the Configure a GigaSMART Group section.
|
c.
|
Select the required interface. By default, Management Interface is enabled. To export the data through IP interface, uncheck the Management Interface check box. You can view the IP Interface field only after you select a GigaSMART Group. |
|
d.
|
Select an IP interface that is used to create a dedicated channel to communicate all application statistics to GigaVUE-FM. You can also choose to create a new IP interface. |
|
f.
|
Enable the fastmode option for performance (less CPU cycles and less memory utilization) improvement. When the fastmode is enabled, some or all of the attributes of the applications will be disabled. You can view the list of attributes/applications available in the fast mode by navigating to the app editor under AMI feature in the FM. If all the attributes of the application are disabled then the application itself is disabled. Refer Fast Mode for more information. |
Note: The fastmode feature is supported only on GigaVUE HC Series. The fastmode option can be enabled or disabled only when creating a new application intelligence session.
|
5.
|
In the User Defined Applications section, select the template from the inventory where it was created. |
|
6.
|
If you are unable to view the required port in the Port field, perform these steps: |
|
o
|
Click Port Editor. Select the Type as Tool from the drop-down list for the required Port Id. Select OK. |
The selected Port appears in the list.
|
o
|
IPv4 - to allow the traffic in IPv4 interface. |
|
o
|
IPv6 - to allow the traffic in IPv6 interface. |
|
o
|
Provide the IP Address, IP Mask, Gateway, and MTU. Provide the IP address corresponding to the IP interface selected. |
|
7.
|
In the DestinationSettings, enter the destination IP address. The version of IP address in the Destination field should be same as the version of IP address defined in the IP-interface (applicable only when IP interface is selected). By default, the IP address of the GigaVUE-FM interface is displayed. |
|
8.
|
In the Source Traffic section, select a source port that require application monitoring in the Source ports field. Source port can be a single port, multiple ports, and port groups. |
Note: Ports already used as source ports in the intent-based orchestrated solution will not be listed in the drop-down.
|
9.
|
Configure the rules for filtering the required traffic in the L2-L4 Rules fields. To configure a rule: |
|
a.
|
Click Select Conditions. Select the required parameters from the drop-down list. |
|
b.
|
Select the value for the parameters from the drop-down. |
|
c.
|
Select the required options: |
|
•
|
Pass or Drop - Based on the parameter selected in the Conditions fields, the traffic that matches the conditions will either be passed or dropped. |
|
•
|
Bidirectional - Allows the traffic in both directions of the flow. |
Note: Click “+” to create multiple rules for filtering the required traffic, and click “+ New Source Traffic” to create multiple sources with filtering options.
|
10.
|
Click Save. The session created is added in the list view. |
 Create an Application Intelligence Session in Virtual Environment
Complete the following prerequisites before creating an Application Intelligence solution in the virtual environment:
To create an Application Intelligence Session:
|
1.
|
On the left navigation pane, select Traffic > Solutions > Application Intelligence. |
|
2.
|
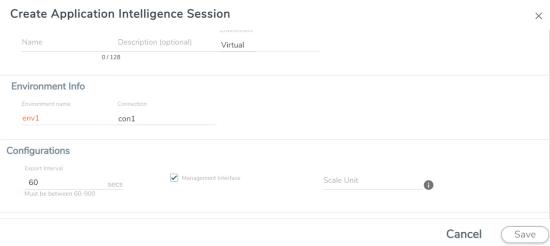
Click Create New. The Create Application Intelligence Session page appears.
 |
|
3.
|
In the Basic Info section, enter the name and description, and in the Environment select Virtual for the session to be created: |
|
■
|
Virtual- connects to the specific environment. |
|
4.
|
In the Environment section, select the Environment Name, and the Connection Name. To create an Environment and connection, refer to Configure Environment . |
|
5.
|
In the Configurations section, complete the following: |
|
a.
|
Select an Export Interval during which you want the Application Intelligence session to generate the reports for application visualization. The valid range is 60–900 seconds. |
|
b.
|
Select the required interface. By default, Management Interface is enabled. To export the data through tunnel interface, uncheck the Management Interface check box. |
|
c.
|
Enter a value for the Scale Unit. The scale unit represents the number of flows supported by the application. If the scale unit value is 1, the maximum active flow limit will be 100k.
Refer to the following table for the maximum scale unit supported for VMware, AWS, and Azure platforms.
Note: Scale Unit is not applicable for the OpenStack platform. | Cloud Platform | Instance Size | Maximum Scale Unit |
|---|
VMware | Large (8 vCPU and 16 GB RAM) | 3 | AWS | Large (c5n.2xlarge) | 4 | Medium (t3a.xlarge) | 3 | Azure | Large (Standard_D8s_V4) | 9 | Medium (Standard_D4s_v4) | 3 |
|
|
6.
|
In the Source Traffic section, select anyone of the following: |
|
■
|
Source Selector‑ Select the source from the drop-down list box. To create new source, select New Source Selector and add the filters. For more information on creating a New Source Selector, refer to Create Source Selectors. |
|
■
|
Tunnel Specification- Select the tunnel from the drop-down list box. To create new tunnel, select New Source Tunnel Spec and add the details for the tunnel. For more information on creating a new tunnel, refer to Create Tunnel Specifications. |
- Tunnel Specification for the source must always be configured with Traffic Direction as IN, to indicate that it is an ingress tunnel.
- For Azure Connection, VXLAN is the only supported Tunnel Type.
|
7.
|
Click Save. The session created is added in the list view. |
|
8.
|
In the User Defined Applications section, select the template from the list. For information on Supported protocols and Attributes and Limitations refer User Defined Application topic. |
The total applications participating in the network traffic are displayed in the Application Intelligence Dashboard. For more information about the dashboard, refer to the View the Application Intelligence Dashboard.
If the session configuration is unsuccessful, troubleshoot the error notified (refer to
View the Health Status of a Solution). Click the Reapply all pending solutions button  in the dashboard to redeploy the configuration.
Note: GigaVUE-FM takes few minutes to display the application statistics.
You can also filter the traffic based on the applications. For more information, see Application Filtering Intelligence.
 Upgrading the Protocol Signature
You can upgrade the protocol signature by upgrading the image file on the GigaSMART card, and by uploading the GigaSMART card image to GigaVUE-FM from the Internal Server or External Server. To select the image, follow the steps:
- Internal Server—Upload the GigaSMART card image to GigaVUE-FM from the internal server and select the image that you need to upgrade from the selected GigaSMART card.
- External Server—Provide the location of the image in the external server that you need to upgrade from the GigaSMART card.
For more information on upgrading the image, refer to the following topics in the GigaVUE-OS Upgrade guide:
-
Upgrade from an External Image Server
-
Upgrade with GigaVUE‑FM as the Image Server
Disable Application Visibility in Application Intelligence Session
To disable Application Visibility, do the following:
|
1.
|
Edit the Application Intelligence Session. |
|
2.
|
Disable the checkbox next to Monitoring Enabled. |
After disabling the monitoring session, the Application Intelligence dashboard does not receive the updates and a message " Monitoring has been disabled. Please enable monitoring to get latest data " is shown in red at the top of the dashboard.
Fast Mode
The DPI engine provides a performance optimization functionality called “fast mode”. In this mode the performance (less CPU cycles) is increased by the use of light parsers for processing the HTTP and DNS traffic.
Benefits of Fast Mode
|
o
|
This increases the performance of HTTP and DNS based protocols. |
|
o
|
This reduces the memory utilization. |
Limitations of Fast Mode
|
o
|
This affects the classification of applications over HTTP. Only limited applications based on HTTP can be classified. |
|
o
|
This affects the attribute extraction. For example, only some attributes are extracted for the HTTP traffic and no attributes are extracted for the DNS traffic. When the fast mode is enabled, the FM automatically displays only the attributes that are supported. |
Note: In the protobook, you can check if a specific application supports the fast mode or not, by navigating to the Attributes tab of the specific application. If the Basic DPI Support field is yes, then the application supports the fast mode option.

 in the dashboard to redeploy the configuration.


