Create Monitoring Domain
You must establish a connection between GigaVUE‑FM and your Azure environment before you can perform the configuration steps. Creating a monitoring domain in GigaVUE-FM allows you to establish a connection between your Azure environment and GigaVUE-FM. After establishing a connection, you will be able to use GigaVUE‑FM to specify a launch configuration for the G-vTAP Controllers, GigaVUE V Series Proxy, and GigaVUE V Series Nodes in the specified VNet and Resource Groups. GigaVUE‑FM connects to Azure using either an Application ID with the client secret or the MSI method of authentication. After the connection establishment, GigaVUE‑FM launches the G-vTAP Controller, GigaVUE V Series Proxy, and GigaVUE V Series 2 Node.
To create an Azure monitoring domain in GigaVUE‑FM:
- Go to Inventory > VIRTUAL > Azure, and then click Monitoring Domain. The Monitoring Domain page appears.
- In the Monitoring Domain page, click New. The Azure Monitoring Domain Configuration wizard appears.
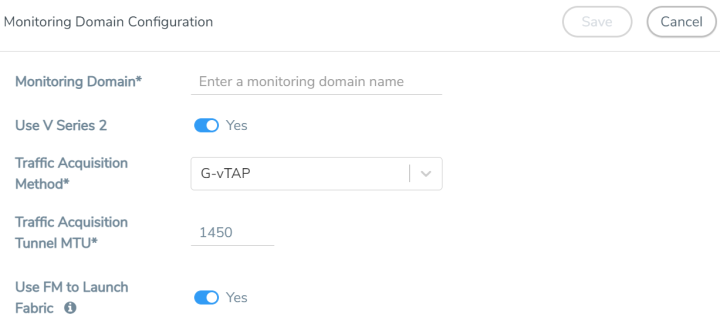
- Enter or select the appropriate information for the monitoring domain as described in the following table.
Field
Description Monitoring Domain
An alias used to identify the monitoring domain.
Use V Series 2
Select Yes for V Series 2 configuration. Traffic Acquisition Method
Select a Tapping method. The available options are:
G-vTAP: If you select G-vTAP as the tapping method, the traffic is acquired from the G-vTAP Agents installed on your standard VMs in the Resource Group or in the Scale Sets. Then the acquired traffic is forwarded to the GigaVUE V Series nodes. You must configure the G-vTAP Controller to monitor the G-vTAP Agents. Note: Select the Traffic Acquisition Method as
Traffic Acquisition Tunnel MTU
The Maximum Transmission Unit (MTU) is the maximum size of each packet that the tunnel endpoint can carry from the G-vTAP Agent to the GigaVUE V Series node.
For VXLAN, the default value is 1450. The G-vTAP Agent tunnel MTU should be 50 bytes less than the agent's destination interface MTU size.
Use FM to Launch Fabric
Select Yes to Configure GigaVUE Fabric Components in GigaVUE-FM or select No to Configure GigaVUE Fabric Components in Azure.
Connections
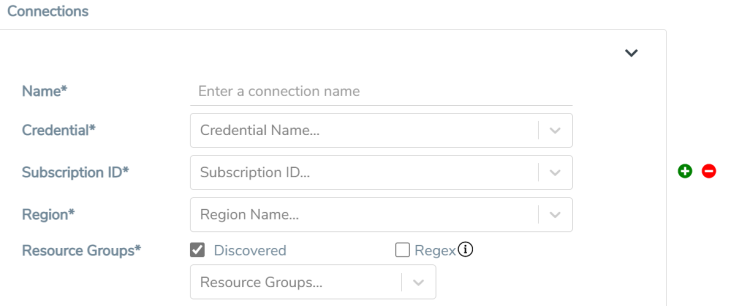
Note: You can add multiple connections in a monitoring domain. Refer to Create Azure Credentials for more information on adding multiple Application ID with Client Secret authentication credentials.
Name
An alias used to identify the connection.
Credential
Select an Azure credential. For detailed information, refer to Create Azure Credentials.
Subscription ID
A unique alphanumeric string that identifies your Azure subscription.
Region
Azure region for the monitoring domain. For example, West India.
Resource Groups
Select the Resource Groups of the corresponding VMs to monitor.
Note: This field is only available if you select G-vTAP as the Traffic Acquisition Method.
- Click Save and the Azure Fabric Launch Configuration wizard appears.
Managing Monitoring Domain
You can view the details of the monitoring domain that are created in the list view. The list view details can be viewed based on:
You can also filter the monitoring domain based on a specified criterion. In the monitoring domain page there are two filter options as follows:
| Right filter - Click the Filter button on the right to filter the monitoring domain based on a specific criterion. |
| Left filter - Click the |
To edit or delete a specific monitoring domain, select the monitoring domain, click the ellipses  .
.
When you click a monitoring domain, you can view details of it in a split view of the window. In the split view window, you can view the details such as Configuration, Launch Configuration and V Series configuration.
Monitoring Domain
The list view shows the following information in the monitoring domain page:
| Monitoring Domain |
| Connections |
| Tunnel MTU |
| Acquisition Method |
| Centralized connection |
| Management Network |
Note: Click the ![]() to select the columns that should appear in the list view.
to select the columns that should appear in the list view.
Use the following buttons to manage your Monitoring Domain:
| Button | Description | ||||||||||||||||||
|
New |
Use to create new connection |
||||||||||||||||||
|
Actions |
You can select a monitoring domain and then perform the following options:
|
||||||||||||||||||
|
Filter |
Filters the monitoring domain based on the list view options that are configured:
You can view the filters applied on the top of the monitoring domain page as a button. You can remove the filters by closing the button. |
Connections Domain
To view the connection related details for a monitoring domain, click the Connections tab.
The list view shows the following details:
| Connections |
| Monitoring Domain |
| Status |
| Fabric Nodes |
| User Name |
| Region |
Fabric
To view the fabric related details for a monitoring domain, click the Fabric tab.
The list view shows the following details:
| Connections |
| Monitoring Domain |
| Fabric Nodes |
| Type |
| Management IP |
| Version |
| Status - Click to view the upgrade status for a monitoring domain. |
| Security groups |
G-vTAP Agents
To view all the G-vTAP agents associated with the available monitoring domains click the G-vTAP Agents tab.
The list view shows the following details:
| Monitoring Domain |
| IP address |
| Registration time |
| Last hearbeat time |
| Agent mode |
| Status |
Refer to Configure the OpenStack Settings, for information regarding Settings.


