Corrective Actions for GigaVUE-FM Alarms
This section provides corrective actions that you must perform when you see an Alarm.
Description
This alarm is generated under the following circumstances:
| The status of the port is Admin-Enabled, however, the port's link is down. |
| The port's traffic is unhealthy based on the configured parameters. |
Corrective Action
| 1. | Check whether the connections are enabled at the port. |
| 2. | Check the port's hardware status. |
| 3. | Check whether the traffic crosses the upper or lower threshold value defined. |
| 4. | Check whether the GigaSMART engine ports have traffic drops. |
| 5. | Contact Customer Support. |
Description
This alarm is generated when a port pair becomes unhealthy based on the associated ports.
Corrective Action
Refer to Port Unhealthy.
Description
This alarm is generated when a port group becomes unhealthy based on the associated ports or GigaStreams.
Corrective Action
Refer to Port Unhealthy.
Description
This alarm is generated based on the health status of the tunnel ports. Tunnel ports are supported in devices that run on GigaVUE-OS versions 5.4.xx and below. The tunnel port is replaced with IP Interface on devices that run on GigaVUE-OS versions 5.5.xx and above.
Corrective Action
| 1. | Check whether the IP address of the tunnel is resolved. |
| 2. | If the ARP is unresolved, check the configurations at the port level. |
| 3. | If the ports associated with the tunnel is unhealthy, refer to Port Unhealthy. |
Description
This alarm is generated based on the health status of the ports that are attached to the IP Interface.
Corrective Action
| 1. | Check whether the IP address of the IP interface is resolved. |
| 2. | If the ARP is unresolved, check the configurations at the port level. |
| 3. | If the ports associated with the IP interface is unhealthy, refer to Port Unhealthy. |
Description
This alarm is generated when a map becomes unhealthy based on the health of the components associated with the map. The components include ports, port groups, virtual ports, GigaStreams, IP interfaces, inline tools, inline tool groups, inline networks, inline network groups, tool mirror, and so on.
Corrective Action
Refer to the following sections:
Description
This alarm is generated when the GigaStream is unhealthy based on the health of the components associated with the GigaStream or when the traffic distribution across the ports in a GigaStream exceeds or falls below a user-defined threshold value.
Corrective Action
- Check if the underlying ports are unhealthy, refer to Port Unhealthy.
- Change the Advanced Hash settings
- Use a Weighted GigaStream to apply more hashing buckets to under utilized ports and lesser hashing buckets to over utilized ports
Description
This alarm is generated when the inline network ports associated with the inline network is unhealthy.
Corrective Action
Refer to Port Unhealthy.
Description
This alarm is generated when the inline ports or inline networks associated with the inline network group is unhealthy.
Corrective Action
Refer to Port Unhealthy.
Description
This alarm is generated when the inline tool ports associated with the inline tool is unhealthy.
Corrective Action
- Check if the heartbeat of the inline tool is healthy.
- Check if the inline tool is enabled.
- Refer to Port Unhealthy.
Description
This alarm is generated when the inline ports or inline tools associated with the inline tool group is unhealthy.
Corrective Action
Refer to Port Unhealthy.
Description
This alarm is generated for a tunnel logical group when the components (maps and IP Interfaces) participating in the tunnel encapsulation and tunnel decapsulation turn unhealthy.
Corrective Action
- Check the health status of the IP Interface and maps components associated with tunnel logical group encapsulation and decapsulation.
- Bring up the health status of the required component to clear the alarm.
Description
This alarm is generated when computed traffic drop value for a given entity exceeds the configured threshold value. For software version 6.1.00, Traffic Drop Identification is supported only for Tunnel Logical Group.
Corrective Action
Check and fix the following:
- Network Connectivity used for tunnel encapsulation and decapsulation.
- Over Utilization of the link.
- Incorrect tunnel encapsulation and decapsulation configuration.
Re-evaluate threshold value that must be configured in the alert policy.
Description
This alarm is generated when the Fabric Map is unhealthy due to its associated components.
Corrective Action
- Check the health status of the ports or GigaStream associated with the Fabric Map.
- Bring the health status up for the required component to clear the alarm.
Description
This alarm is generated when certain applications or processes overload the memory of the device.
Corrective Action
| 1. | Run the show system-health box-id <box id> command. The memory usage statistics such as the total, used, and free amount of physical and swap memory available are displayed. The memory usage for all the processes is displayed and the process consuming the largest amount of memory is displayed at the top. Refer to Display the System Health Statistics. |
| 2. | Make a note of the processes that have crossed the pre-defined threshold value for the device. Refer to Enable the System Health Threshold Notification. |
| 3. | Make a note of all the configuration changes after which the alarm was generated. |
| 4. | Run the debug generate dump command to generate a system dump file. |
| 5. | Contact Customer Support. |
Description
This alarm is generated when certain applications or processes overload the CPU of the device.
Corrective Action
| 1. | Run the show system-health box-id <box id> command. The CPU utilization statistics such as the CPU load average over the last 5 secs, 1 minute, and 5 minutes are displayed. In addition, all the processes running in the cluster or a specified node in the cluster display the CPU utilization for the last 5 second, 1 minute, and 5 minute intervals. The process consuming the largest amount of CPU is displayed at the top. Refer to Display the System Health Statistics. |
| 2. | Make a note of the processes that have crossed the pre-defined threshold value for the device. Refer to Enable the System Health Threshold Notification. |
| 3. | Make a note of all the configuration changes after which the alarm was generated. |
| 4. | Run the debug generate dump command to generate a system dump file. |
| 5. | Contact Customer Support. |
Description
During clustering operations, there may be system errors that put the cluster or clustered nodes into unsafe or unstable state. When the node or cluster is at this state, the upcoming configurations or operations may cause the system to crash, cluster to deform, and data traffic to be impacted.
Corrective Action
You need to reset the device. Refer to
Description
This alarm is generated due to various reasons. Most common scenarios are:
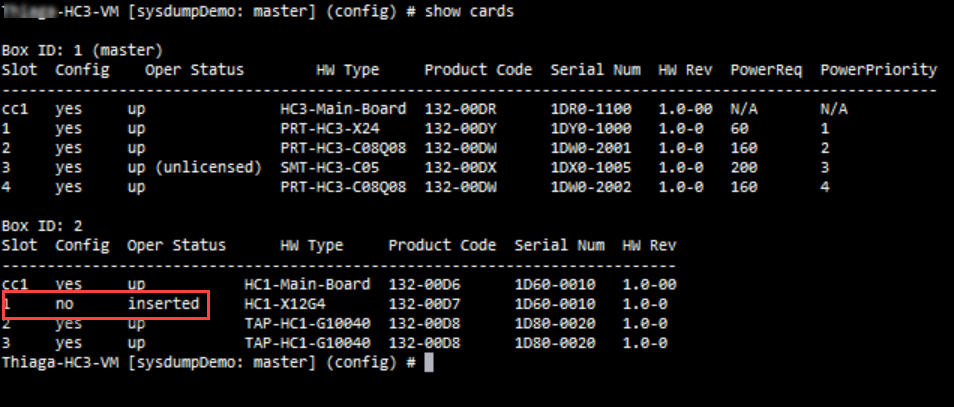
| The operational status of the card is "inserted", but the card is not configured. |
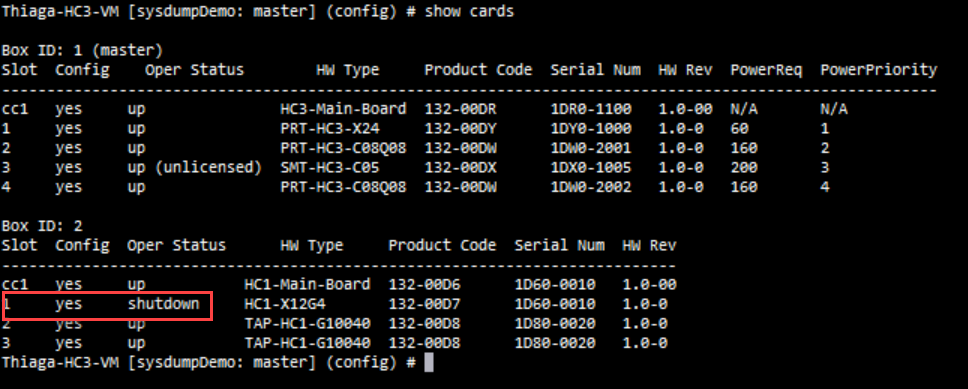
| The card is configured but the operational status of the card is "shutdown". |
| At least 50% of the ports in the card are down. |
Corrective Actions
| 1. | Run the show cards command. The card information is displayed. Refer to Displaying Cards. |
| 2. | If the operational status of the card is "inserted", but the card is not configured (as shown in the figure below), run the card <box ID>/<slot ID> command to configure the card. |
| 3. | If the card is configured but the operational status of the card is "shutdown" (as shown in the figure below), run the no card slot <slot ID> down command to reactivate the card. |
Description
The status and speed of the fan may not be available or the fan trays may not be functional. This may increase the device temperature.
Corrective Action
Perform the following tasks to troubleshoot this issue:
- Run the show chassis command and verify the fan tray status.
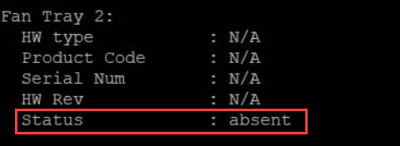
- If the status is displayed as absent (as depicted in the screenshot above), check and ensure that the fans are inserted properly.
- Run the show chassis command again to verify the fan tray status.
- Run the show environment type fan command to verify the fan speed in RPM.
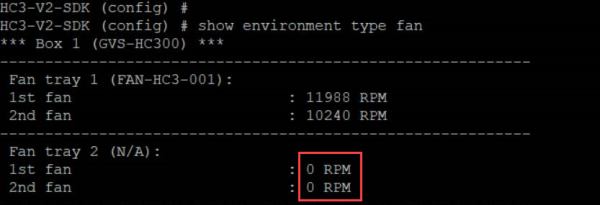
- If the RPM is displayed as 0, contact customer support.
Note: Ensure that you collect the logs of the show chassis and show environment type fan commands.
Description
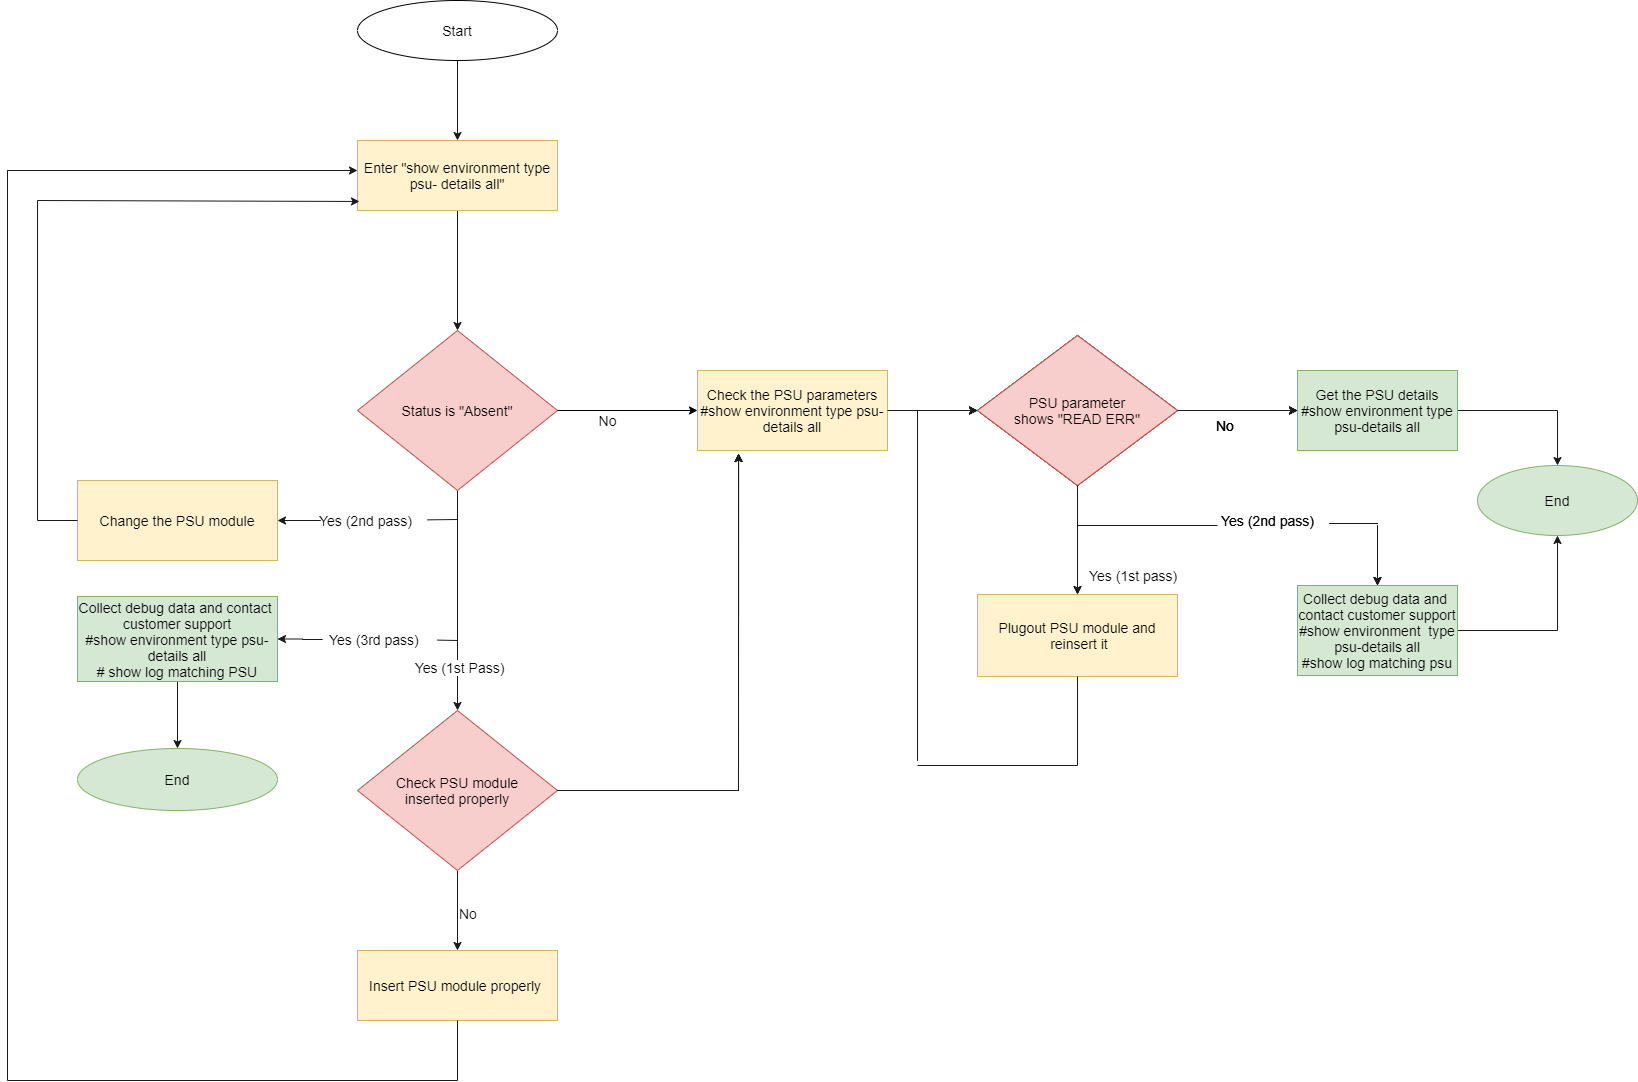
This alarm is generated when the power supply module is faulty.
Corrective Action
Here are the set of tasks depicted in the form of a flow chart. Perform these tasks to troubleshoot this issue.
Description
This alarm is generated when the health status of the battery is below the defined threshold value. If the charge is below 75%, it is indicated by yellow and if it is below 50%, it is indicated by red.
Corrective Action
| 1. | Make sure that the power supply is connected. |
| 2. | Check the reason for the power outage. |
| 3. | Configure the Battery Optimization feature to avoid traffic drops. Refer to battery optimization. |
| 4. | If power is available but battery is not getting detected or charged, remove and reinsert the battery properly. |
Description
This alarm is generated when the underlying ports of the G-TAP port group is not compatible with the transceiver and speed.
Corrective Action
-
Change the transceiver to match equal speed on all the four ports of G-TAP port group.
Description
This alarm is generated when the temperature of the device's CPU exceeds the threshold value.
Corrective Action
| 1. | Ensure that all the fans are working properly. |
| 2. | If there is a fan failure detected, remove and re-insert the fan tray. |
| 3. | Run the show system-health command and get the details. Contact Customer Support. |
Description
This alarm is generated when the status of the stack link or stack GigaStream is unhealthy.
Corrective Action
| 1. | If the Stack link is unhealthy: |
- Run the show port params command to check the power level of the transceiver used.
- Disable and then enable the ports to bring the stack link up.
| 2. | If Stack GigaStream is unhealthy, reconfigure the Stack GigaStream. |
| 3. | If the status is still unhealthy, verify the transceiver inserted in the port. |
| 4. | If the port flaps continuously before or during the state, flap the port and then observe the power level of the port. |
| 5. | Reload the device and then check the status. |
| 6. | If the status is still unhealthy, contact Customer Support. |
Description
These alarms are generated when a standalone device is unreachable and the health status of the physical and logical components of the unreachable device could not be determined.
Corrective Action
- Ping the DNS name or IP Address of the device.
- Check the Console Access of the device.
Description
These alarms are generated when a device that is part of a cluster leaves the cluster and therefore is unreachable. Also, the health status of the physical and logical components of the unreachable device could not be determined.
The alarm gets cleared if the device comes online with the same IP address or with a different IP address and is added as a member of the same cluster.
Corrective Action
- Check if the device is still part of the cluster.
- Use the following show command to see if the device is part of the cluster.
Show cluster global brief
Description
This alarm is generated when a member node becomes not-reachable to the cluster leader.
Corrective Action
- Check and try to bring up the cluster.
- Add the node to the same cluster.
Description
This alarm is generated when the health status of the GigaSMART engine ports that are associated with the GigaSMART group become unhealthy.
Corrective Action
| 1. | Run the show port command to check the link status. |
| 2. | If the link status is down, run the show cards command to check the operational status of the GigaSMART engine port. The status should be Up or Shutdown. If the status is Shutdown, bring up the card. |
| 3. | If the status is down, contact Customer Support. |
| 4. | Run the show port stats portlist <engine port alias> command to check whether there are any IfInPktDrops. If there are packet drops, GigaSMART engine may be oversubscribed. |
Description
This alarm is generated when the health status of the GigaSMART group to which the virtual port is associated with is unhealthy.
Corrective Action
- Run the show vport command to determine the GigaSMART group to which the virtual port is associated with.
- Check the health status of the GigaSMART engine port.
- Run the show port stats portlist <engine port alias> command to check whether there are any IfInPktDrops. If there are packet drops, GigaSMART engine may be oversubscribed.
Description
This alarm is generated when the GigaSMART group that the GSOP is associated with is unhealthy.
Corrective Action
- Run the show gsgrp command to determine the GigaSMART group to which the GSOP is associated with.
- Refer to Gsgroup Unhealthy


