Use Case: Enhance Context for Incident Response
This use case helps security teams accelerate investigation and response by enriching incident data with deep network visibility. When an alert provides an IP address and timestamp, you can query your NDR solution for network‑forensic details, such as DNS queries, HTTP activity, and other enriched metadata, to understand what was happening at the exact moment of the incident.
To enable this level of contextual insight, you must configure Application Metadata Intelligence (AMI) and Application Visualization. These components work together to extract, classify, and present application‑layer metadata, allowing analysts to correlate alert information with detailed traffic behavior during incident triage.
Applicable Map Components
The following table lists the map components you must configure for this use case.
|
Map Components
|
Sample Configuration
|
|
Source
|
Network ports - 1/1/x5
|
|
Source Ruleset
|
N/A
|
|
Application Ruleset
|
N/A
|
|
Applications
|
|
●
|
Application Visualization |
|
o
|
Exporter Details: Create the Tool IP interface to which metadata should be sent for visualization. This is the destination interface on the monitoring or analytics tool that receives enriched metadata for processing. Selecting the correct Tool IP ensures that application insights and traffic attributes are forwarded accurately, enabling effective visibility and analysis on the downstream platform. |
|
■
|
Tool IP Interface - IP-1 |
|
■
|
Tool Destination IP - 1.1.1.1 |
|
o
|
Application Attributes: Export the specific metadata your tools need for deep investigation. These metadata attributes enriches each flow record with high‑value context while avoiding unnecessary fields, helping downstream tools improve detection accuracy and reduce storage and processing overhead. |
|
■
|
Application Family - network-service; Application - dns; Attributes - query, reply-code, response-time |
|
■
|
Application Family - web; Application - http; Attributes - accept, code, response-ts |
|
■
|
Application Family - encrypted; Application - ssl; Attributes - cipher-suite-id, protocol-version, validity-not-after |
|
o
|
Advanced Settings: Use timestamps to capture the exact start and end time of each flow, enabling precise correlation with alert timestamps and detailed timeline reconstruction. Use the IPv4 source and destination address prefixes to export flows per host IP, rather than as aggregated subnets, so downstream tools can accurately identify the specific endpoints involved in an incident. |
|
■
|
Timestamp - Flow Start (milliseconds) and Flow End (milliseconds) |
|
■
|
IPv4 - Source Address and Destination Address Prefix set to /32. |
|
●
|
Application Metadata Exporter. |
|
|
Destination
|
N/A
|
To configure a Traffic Policy with the above sample configurations:
|
1.
|
Access Traffic Policy. |
|
a.
|
In GigaVUE-FM, go to Traffic > Traffic Policy. The Traffic Policy landing page appears. |
|
b.
|
Click New Map in the top right corner of the landing page. The New Map dialog appears. |
|
c.
|
In the New Map dialog, do the following: |
|
•
|
Alias - Enter GTP- Control. |
|
•
|
(Optional) Description - Enter the description for the Traffic Policy. |
|
•
|
(Optional) Enabled - Clear this option, if you want to disable the map. By default, this option is selected. |
|
•
|
(Optional) Tags - Select a tag key and value for the Traffic Policy, to support policy-level analytics. |
|
d.
|
Click Save. The Traffic Policy canvas appears. |
|
a.
|
Click Sources. The Source 1 page appears. |
|
b.
|
Select the network port 1/1/x1. |
Note: To configure or modify the port type, use the Quick Port Editor.
|
c.
|
Click Add. The Source block appears on the canvas with the selected network port. |
|
a.
|
Expand the Applications component and then drag and drop Application Metadata. The GigaSMART Resource page appears. |
|
b.
|
You can either select an existing GigaSMARTgroup or create a new group by clicking New in the GigaSMART Group field. The Create GigaSMART Group pane appears. |
|
c.
|
Enter a name for the GigaSMART group in the Alias field. For example, gs2port1. |
|
d.
|
Select a GigaSMART engine port from the Port List field, and then click Save. The GigaSMART Resource page appears. |
|
e.
|
Click Proceed. The Exporter 1 pane appears. |
Note: You can create up to a maximum of 5 exporters in an Application Metadata Intelligence solution.
|
f.
|
On the Exporter Details tab, enter Exp1 in the Tool Name field. |
|
g.
|
You can either select an existing Tool IP Interface or create a new IP interface by clicking New in the Tool IP Interface field. The New Tool IP Interface pane appears. |
|
h.
|
Enter an Alias and Description for the Tool IP Interface. |
|
i.
|
Select the tool port 1/1/x11 and then Type as IPv4. |
|
j.
|
Enter 1.1.1.2 in the IP Address field, /24 in the IP Mask field, and then 1.1.1.1 in the Gateway field. |
|
k.
|
Leave the MTU to the default value, and then click Save. The Exporter 1 pane appears. |
|
l.
|
Enter 1.1.1.1 in the Tool IP Address field. This is the IP Address of the Gateway you configured in your Tool IP Interface. |
|
m.
|
Leave the L4 Source Port and L4 Destination port to the default values. |
|
n.
|
Select the tool template you want to use for the exporter. For instructions on how to create a tool template, refer to Create Custom Tool Template. |
|
o.
|
Under the Export Format section, select CEF in the Format field and Segregated in the Record Type field. |
|
p.
|
On the Application Attributes tab, select the following: |
|
•
|
Application Family—network-service; Application—dns; Attributes—query, reply-code, response-time |
|
•
|
Application Family—web; Application—http; Attributes—accept, code, response-ts |
|
•
|
Application Family—encrypted; Application—ssl; Attributes—cipher-suite-id, protocol-version, validity-not-after |
Note:
The AMI exporter exports application metadata for the selected applications but exports packet attributes for all applications. To export packet attributes only for the selected applications, filter the required traffic by using a flow map or AFI.
Flow Direction/Behaviour under Application Metadata Settings must be configured as Bidirectional for exporting application Metadata. Each exporter can be configured to export application metadata for up to 256 applications, and up to 64 attributes can be exported for each application. GigaVUE‑FM allows selecting metadata for applications that support exporting metadata. Applications which do not support exporting metadata are not listed in the GigaVUE‑FM. By default, application name is exported for all such applications.
|
q.
|
On the Advanced Settings tab, add Timestamp and IPv4 from the Add L2-L4 attributes. The Timestamp and IPv4 sections appear. |
|
r.
|
Under the Timestamp section, select Flow Start (milliseconds) and Flow End (milliseconds). |
|
s.
|
Under IPv4 section, enter /32 as the Prefix for the Source Address and Destination Address fields. |
|
t.
|
Click Save. The Application Metadata pane appears. |
|
u.
|
Click Close. The AMI block appears on the canvas. |
|
v.
|
Search Application by youtube-tv, netflix, and netflix-video, and then select the Traffic Action for these applications as Drop. |
|
w.
|
Click Save. The GS-GRP and the AFI blocks appear on the canvas. |
|
x.
|
From the Applications component, drag and drop Application Visualization. The AppViz pane appears. |
|
y.
|
Select Tool IP Interface in the Exporter Interface field, and then select the Tool IP Interface you created while configuring the Exporter for AMI. |
|
z.
|
Click Save. In the Application Visualization dialog box that appears, click Continue. The App Viz block appears on the canvas. |
|
3.
|
Deploy Traffic Policy. |
|
a.
|
On the Traffic Policy canvas, click Deploy to deploy the Traffic Policy in the device. |
|
4.
|
Verify the deployment. |
|
a.
|
Status: In the Traffic Policy landing page, verify that the Traffic Policy shows Deployment Status as Success and Health Status as Healthy. |
|
b.
|
(Optional) Implemented Device: View the generated map and confirm that the traffic statistics is incrementing as expected. |
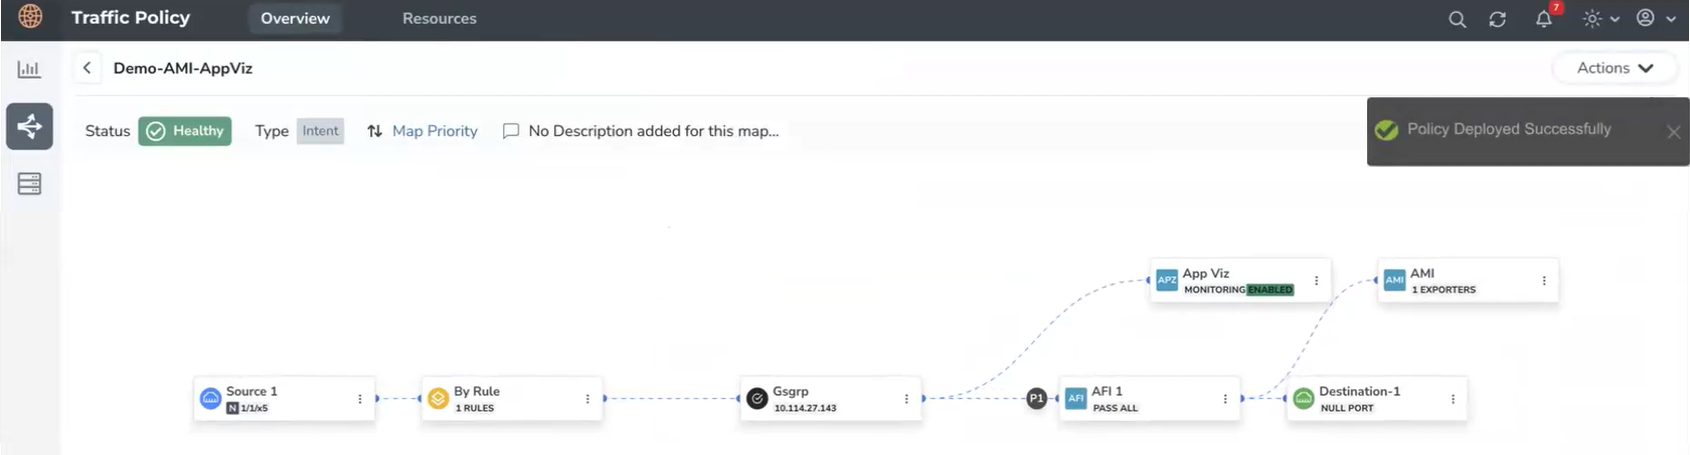
After deploying the Traffic Policy, you notice that GigaVUE‑FM automatically displays the following blocks on the canvas even if you have not configured them. This is expected behaviour. :
|
■
|
By Rule block—
GigaVUE-FM automatically generates a default By Rule to ensure that IPv4 traffic passing through the associated network port is included in the policy flow. This auto‑created rule helps establish the foundational traffic path so you can continue building or refining your Traffic Policy as needed. |
|
■
|
AFI block—GigaVUE-FM places an AFI block on the canvas to represent a default pass‑all filtering map.
This placement helps you clearly understand where application filtering fits within the traffic flow.
|
|
■
|
Destination (Null Port)—
GigaVUE-FM displays a Null port as the default destination to keep the traffic path complete from ingress to egress on the canvas and prevents breaks in the visual workflow.
|


