Telemetry Insights Dashboard
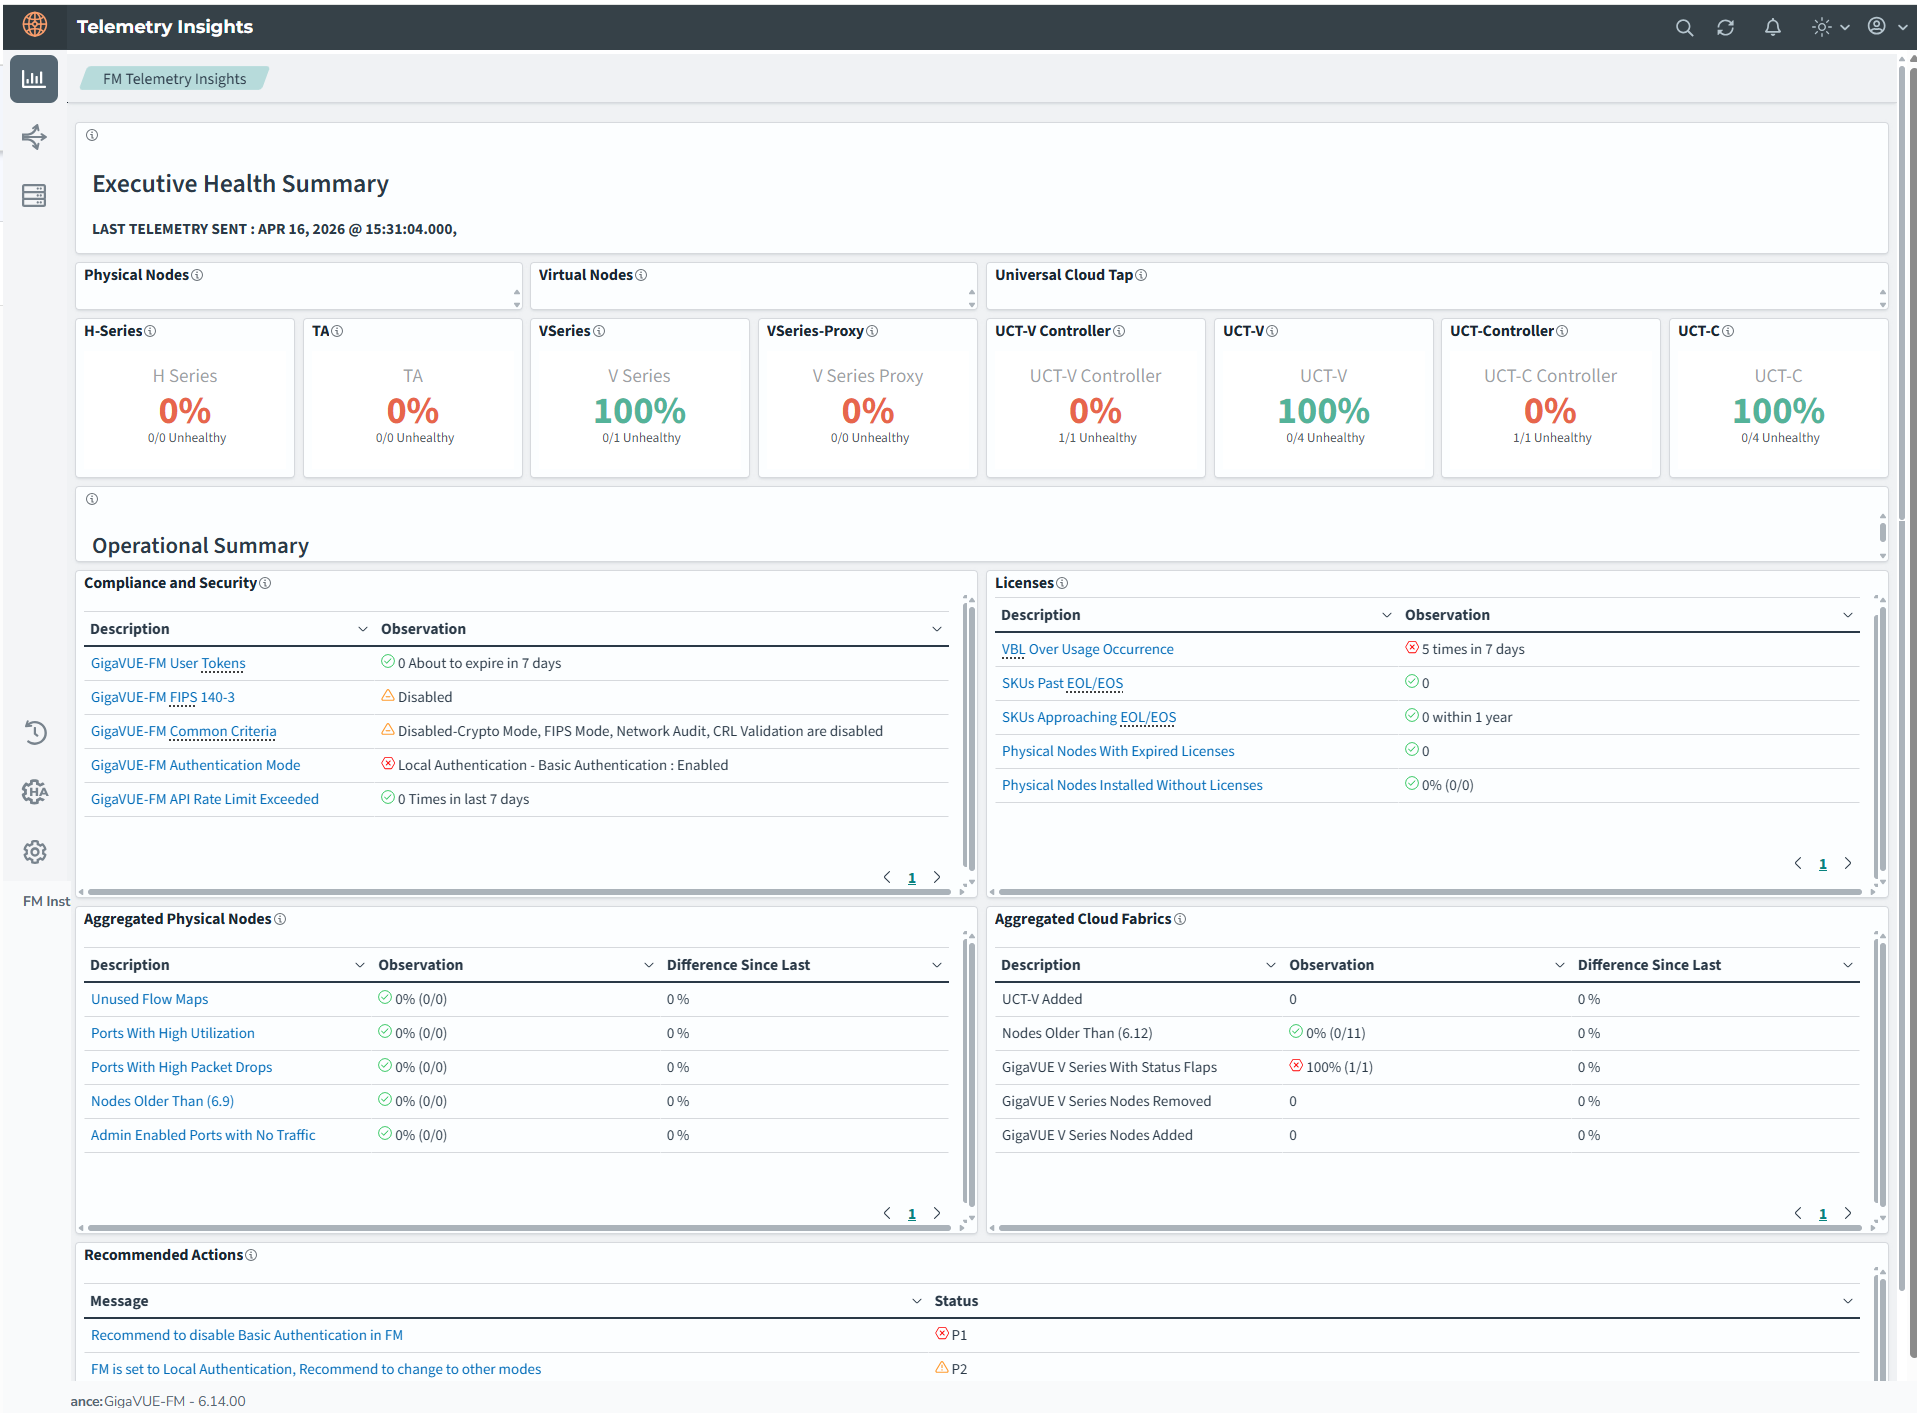
The Telemetry Insight dashboard gives you a single, actionable view of the health, usage, licensing risks, and security posture of your GigaVUE-FM, along with recommended actions.
The Telemetry Insights dashboard has three major sections:
Prerequisites
|
■
|
Enable GigaVUE-FM Connected Experience to populate the Telemetry Insight Dashboard. If you do not enable it, the dashboard shows no data, and GigaVUE-FM does not compute the insight data points. |
|
■
|
Enable SNMP traps on the devices and configure them to send traps to GigaVUE-FM. |
|
■
|
Enable the following trap categories: |
|
o
|
High and low utilization |
Executive Health Summary
Once Connected Experience is enabled in GigaVUE‑FM, the dashboard is populated with subsequent data at 5 AM UTC.
In the Executive Health Summary section, GigaVUE‑FM shows a point-in-time health status of:
|
■
|
Physical nodes such as GigaVUE ® HC Series and TA. |
|
■
|
Virtual nodes such as V Series nodes, and V Series-proxies. |
|
■
|
Universal Cloud Tap (UCT) such as UCT-V Controller, UCT-V, UCT-C, UCT-C Controller. |
This section lets you quickly see whether your physical, virtual, and cloud tap components are healthy or need attention.
Operational Summary
In the Operational Summary section, GigaVUE‑FM highlights the information about:
|
■
|
Compliance and Security: GigaVUE-FM shows operational risks and inefficiencies over the last 7 days, which will help you to understand the performance issues and configuration problems without drilling into multiple device pages. This section helps you to quickly assess whether GigaVUE‑FM and its access controls are configured according to internal policies. It also summarizes configuration elements that affect security, including: |
|
o
|
FIPS Status‑ Whether GigaVUE‑FM is running in FIPS mode. |
|
o
|
Common Criteria Compliant‑ GigaVUE‑FM checks settings such as FIPS, Crypto Mode, Network Audit Log, CRL Validation, and Lock Users, and ensures they are compliant. |
|
o
|
Authentication mode (for example, basic authentication vs third‑party). |
|
o
|
API rate‑limit exceed counts. |
|
o
|
About to Expire tokens -Tokens that are expiring (for example, expiring within 7 days). |
|
■
|
Licenses: This section helps you to identify where you may soon lose support or entitlements so you can renew or migrate in time. You can view information about: |
|
o
|
Installed and expired licenses. |
|
o
|
License SKUs that are approaching End‑of‑Sale (EOS) or End‑of‑Life (EOL). |
|
o
|
License SKUs that are already past EOS or EOL. |
|
o
|
Volume‑based license (VBL) over‑usage in the last 7 days.
|
|
■
|
Aggregated Physical Nodes - This section shows view of health, performance, and configuration-related signals across physical inventory managed by GigaVUE‑FM, helping to identify operational risks, underutilized resources, and nodes that need attention. You can infer the following information: |
|
o
|
Ports with High Packet Drops - Highlights physical ports experiencing sustained packet drops. |
|
o
|
Admin Enabled Ports with no Traffic - Highlights ports that are administratively enabled but not carrying traffic. |
|
o
|
Ports With High Utilization - Tracks ports with high utilization. |
|
o
|
Unused Flow Maps - Shows configured flow maps that are currently not in use. |
|
o
|
Physical Nodes with Older than LTS Version - Shows physical nodes running software versions older than the supported LTS baseline. |
|
■
|
Aggregated Cloud Fabrics - This section summarizes the health of V Series nodes, UCT-V agents. It combines the health signals for those cloud environments into a single cloud-level view so that you can quickly confirm whether there are problems in any of the managed cloud locations. When the aggregated cloud fabrics tile shows issues, you can use the rest of the dashboard and drill-down views to identify which specific cloud nodes or fabrics are affected. You can infer the following information: |
|
o
|
GigaVUE V Series added and deleted - Shows the count of V Series nodes added to or removed from the environment during the reporting window. |
|
o
|
UCT-V Inventory Added - Displays newly added UCT-V instances in the environment. |
|
o
|
Virtual Nodes with outdated Software Version - Highlights virtual nodes running versions behind the supported software baseline. |
|
o
|
GigaVUE V Series with Status Flaps - Highlights V Series nodes whose status is changing frequently between healthy and unhealthy states. |
Recommended actions
In the recommended actions section, you can view the lists of actionable items that are derived from the other sections, such as:
|
■
|
About to expire License |
|
■
|
End Of Sale/End Of Life SKU |
|
■
|
Unreachable Nodes (Node Healthy) Physical |
|
■
|
GigaVUE‑FM Storage Space (/Config /var /root) |
This section helps you to decide what to fix first. For example:
 - Issues marked with this symbol must be treated as Priority 1 (P1).
 - Issues marked this with symbol must be treated as Priority 2 (P2).
 - Issues marked with this symbol must be treated as Priority 3 (P3).
View the Telemetry Insight dashboard
To view the Telemetry Insights Dashboard, in GigaVUE‑FM, go to Dashboard  > System > Telemetry. The Telemetry Insights dashboard page appears.
Rules and Notes
|
■
|
The Telemetry Insight Dashboard shows data only the next day after GigaVUE-FM Connected Experience is enabled. If you do not enable it, the dashboard appears but stays empty. |
|
■
|
Only Super Admin users can view the dashboard. This prevents incomplete views caused by RBAC limits in this release. |
|
■
|
If SNMP traps are not enabled or do not reach GigaVUE-FM, trap‑based sections will be empty or partly filled. GigaVUE-FM still shows sections based on inventory and configuration. |
|
■
|
Dashboard time windows are relative (for example, last 7 days). Absolute dates are not supported. |
|
■
|
Configuration‑change insights show only the changes made through GigaVUE‑FM (GUI, REST API, or other GigaVUE‑FM based methods). GigaVUE‑FM does not capture changes made directly on devices, such as through the device CLI. This may cause lower reported configuration activity. |


