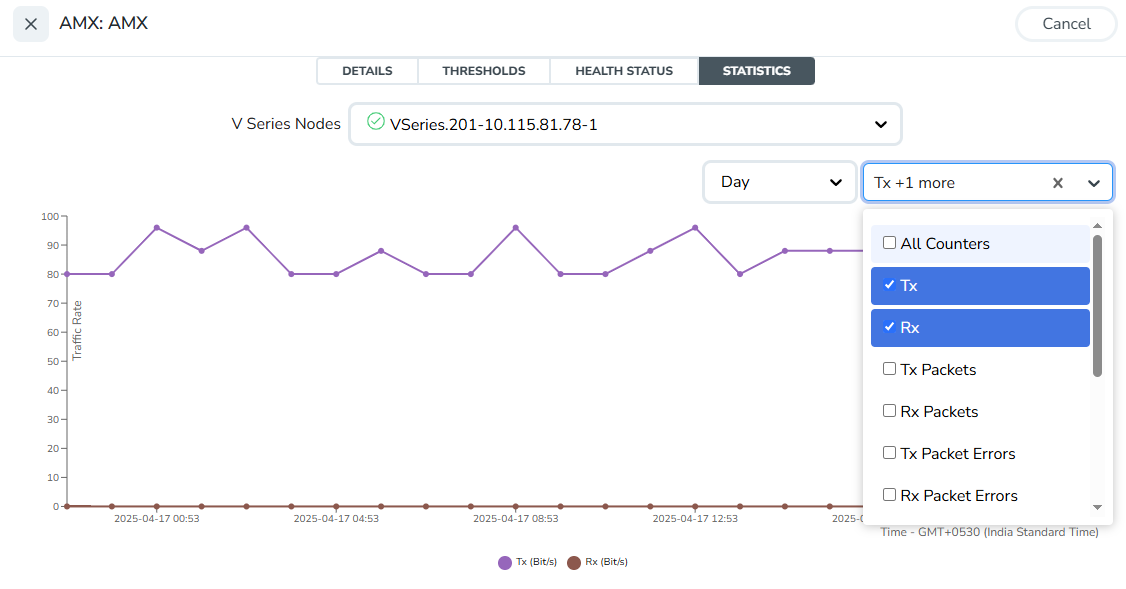
View Application Metadata Exporter Statistics
To view the application Statistics for the Application Metadata Exporter application, follow the steps given below:
| 1. | Go to Traffic > Virtual > Orchestrated Flows > Third Party Orchestration. The Monitoring Sessions Overview page appears. |
| 2. | Select the monitoring session you want to view the statistics. |
| 3. | Go to the TRAFFIC PROCESSING tab. In the canvas page, click the  menu button on the AMX application and select Details. The Application quick view appears. menu button on the AMX application and select Details. The Application quick view appears. |
| 4. | Click on STATISTICS tab. |
| 5. | To view the statistics of a particular GigaVUE V Series Nodes, select the required GigaVUE V Series Node from the V Series Node IP dropdown menu to view the Ingestor, Exporter, and Attributes Enrichment statistics. |
You can download the Ingestor and Exporter statistics using the following options:
| Download TCP Dump (Ingestor)- Select this option to download the PCAP file (for example, cap_ens192_20260407_073719655-run-001.pcap.gz). The TCP dump capture is limited to 100 packets and runs for up to 30 seconds, or until 100 packets are captured (whichever occurs first). You can capture a TCP dump for only one AMX ingestor at a time. The TCP dump download option is available only for the following ingestor types: AMI, NetFlow/IPFIX, Mobility, and Zscaler LSS. |
| Download Records (Exporter) - Select this option to download the JSON file (for example, Elastic-exporter-records.json.gz) of the exporter records. You can download records for a single AMX exporter or for multiple exporters. The exporter record download waits up to 30 seconds for records to be exported. If no records are produced, the operation times out. |
For instructions on how to download the ingestor and exporter records, and troubleshoot AMI/AMX issues, refer to Troubleshoot AMI/AMX Deployment.
For more information on health status of exporters, refer to View Health Status.
You can view the following parameters in the Application Metadata Exporter application statistics page.
Exporter - Statistics to monitor exports from AMX
|
Parameters |
Description |
|
Name |
Displays the name of exporters created for this application. |
|
Exported Entries |
Displays the number of entries available in the files that will be uploaded from AMX to the cloud tool or the Kafka consumers. |
|
Average File Size |
Displays the average size of the file. |
|
File Upload Errors |
Displays the number of file uploaded from the AMX to the cloud tool or the Kafka consumers. |
|
File Upload Errors |
Displays the number of times the file was not uploaded to the cloud tools or Kafka consumers due to errors. |
|
Re Exported Entries (Only for Kafka Tool Exporter) |
Displays the number of records re-exported from the errors directory after the Kafka tool is restored. Errored files are re-exported automatically at a rate of 10 files per 5 seconds. |
| Exported Entries Rolling 15 Sec |
Displays the rolling average of entries exported per second over the past 15 seconds. |
| Exported Entries Rolling 30 Sec |
Displays the rolling average of entries exported per second over the past 30 seconds. |
| Exported Entries Rolling 60 Sec |
Displays the rolling average of entries exported per second over the past 60 seconds. |
| Exported MBytes | Total number of megabytes exported. |
| Exported MBytes Rolling 15 Sec | Rolling average of megabytes exported over the past 15 seconds. |
| Exported MBytes Rolling 30 Sec | Rolling average of megabytes exported over the past 30 seconds. |
| Exported MBytes Rolling 60 Sec |
Rolling average of megabytes exported over the past 60 seconds. |
Ingestor - Statistics to monitor ingestion
|
Parameters |
Description |
|
Name |
Displays the name of the ingestor created for this application. |
|
Packets Received |
Displays the packets received from the AMI to AMX ingestor. |
|
Packets Dropped |
Displays the packets dropped when the traffic passes from AMI to AMX ingestor. |
|
Octets Received |
Displays the octets received from the AMI to AMX ingestor. |
|
Octets Dropped |
Displays the octets dropped when the traffic passes from AMI to AMX ingestor. |
| Records Added | Displays the number of workload information pulled from the workload environment. |
| Records Dropped | Displays the number of the workload details that were dropped from the workload environment. |
| Request Success | Displays if the workload information was fetched from the cloud environment. The default interval at which the AMX fetches the workload information is 60 seconds. |
| Request Authentication Errors | Displays if the workload information was not fetched from the cloud environment due to any authentication errors like wrong password. |
| Request Timedout Errors | Displays if the workload information was not fetched from the cloud environment even after the default interval of 60 seconds. |
| Request Errors | Displays when the workload information could not be fetched from the cloud environment due to issues other than authentication failures or timeout conditions. |
| Decode Success | Displays number of successful decoding operations performed by a system when processing NETFLOW/IPFIX packets. |
| Decode Fail | Displays the number of failed attempts to decode NETFLOW/IPFIX packets. |
| Elements Skipped | Displays number of data elements that were not processed or were omitted during the NETFLOW/IPFIX ingestion process. |
| Pkts Rx Rolling 15 Sec | Rolling average of packets received per second over the past 15 seconds. |
| Pkts Rx Rolling 30 Sec | Rolling average of packets received per second over the past 30 seconds. |
| Pkts Rx Rolling 60 Sec | Rolling average of packets received per second over the past 60 seconds. |
| Mbytes Rx | Total number of megabytes ingested. |
| Mbytes Rx Rolling 15 Sec | Rolling average of total megabytes received over the past 15 seconds. |
| Mbytes Rx Rolling 30 Sec | Rolling average of total megabytes received over the past 30 seconds. |
| Mbytes Rx Rolling 60 Sec | Rolling average of total megabytes received over the past 60 seconds. |
Attributes Enrichment - Statistics to monitor enrichment
|
Parameters |
Description |
|
Name |
Displays the name of the Metadata enrichment. |
|
One Min Percent |
Displays the percentage of the traffic that is enriched from the last 1 minute. |
| Five Min Percent | Displays the percentage of the traffic that is being enriched from the last 5 minutes. |
| Ten Min Percent | Displays the percentage of the traffic that is being enriched from the last 10 minutes. |
The following image shows the statistical details for general AMX application.