Deploy Monitoring Session (Azure)
You can deploy the Monitoring Session on all the nodes and view the report.
To deploy the Monitoring Session,
- Add components to the canvas
Drag and drop the following items to the canvas as required:Ingress tunnel (as a source): From the New section.
- Maps: From the Map Library section.
- Inclusion and Exclusion maps: From the Map Library to their respective section at the bottom of the workspace.
- GigaSMART apps: From the Applications section.
- Egress tunnels: From the Tunnels section.
- Connect components
Perform the following steps after placing the required items in the canvas.Hover your mouse on the map
Select the dotted lines
Drag the arrow over to another item (map, application, or tunnel).
You can drag multiple arrows from a single map and connect them to different maps.
- (Optional) Review Sources
Select the SOURCES tab to view details about the subnets and monitored instances.The monitored instances and the subnets are visible in orange.
Not applicable for NSX-T solution and Customer Orchestrated Source as Traffic Acquisition Method.
- Deploy the Monitoring Session
From the Actions menu, select Deploy.
After successful deployment on all the V Series Nodes, the status appears as Success on the Monitoring Sessions page.
View the Deployment Report
You can view the Monitoring Session Deployment Report in the SOURCES and V SERIES NODES tab.
-
When you select the Status link, the Deployment Report is displayed.
-
When the deployment is incorrect, the Status column displays one of the following errors:
-
Success: Not deployed on one or more instances due to V Series Node failure.
- Failure: Not deployed on all V Series Nodes or Instances.
-
The Monitoring Session Deployment Report displays the errors that appeared during deployment.
The Monitoring Session Deployment includes two key configuration:
-
Interface Mapping
It allows to associate specific network interfaces (from monitored instances) with monitoring tools. This ensures that traffic from selected sources is accurately mirrored and routed for analysis. You can:
-
Select interfaces from available instances.
-
Map each interface to one or more monitoring tools.
-
Apply filters or conditions to refine traffic selection.
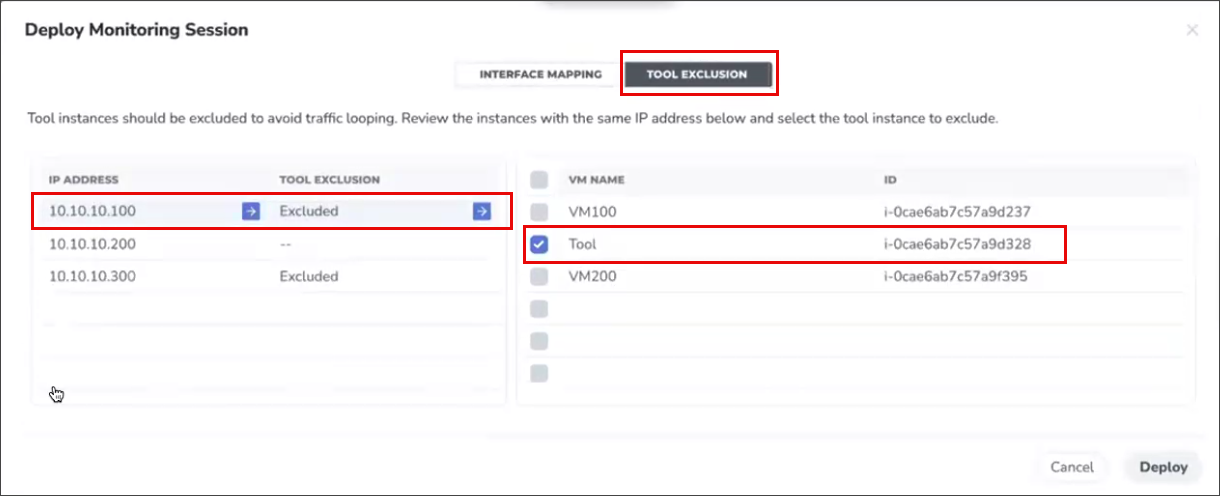
Tool Exclusion
It excludes specific monitoring tools from receiving mirrored traffic during a monitoring session. This option is available only when the Traffic Acquisition method is set to VPC Traffic Mirroring.
-
Review the list of available monitoring tools.
-
Select the tools to exclude from traffic flow.
-
Confirm the exclusion before deploying the session.
-


