Create Raw Endpoint (VMware NSX-T)
This topic explains how to configure a RAW Endpoint (REP) in the Monitoring Session using VMware NSX-T.
Refer to the below sections for more detailed information:
- Rules and Notes
- Create Raw Endpoint (VMware NSX-T)
- Configure Raw Endpoint in Monitoring Session
- Configuration Support for Non IP-Addressable (l2 supported) Tools
Rules and Notes
-
You must use VSS port groups. REPs are not supported on NSX Segments.
-
GigaVUE‑FM requires a valid IP address on the interface used for the RAW Endpoint.
-
For interface roles and details, refer to the GigaVUE V Series Node interface configuration table in the Monitoring Domain documentation.
-
The maximum number of links that can egress from any endpoint in V Series is four.
Points to Note:
Refer to the following table for more detailed information on the number of interfaces and their roles in the GigaVUE V Series Nodes deployed in the Monitoring Domain.
| Display Name | Interface Name | Role | Comments |
|---|---|---|---|
|
Network Adapter 1 |
ens160 |
Management |
- |
|
Network Adapter 2 |
ens192 |
Tunnel |
Supports Tunnel and Egress RAW endpoint. |
|
Network Adapter 3 |
ens224 |
Data |
Reserved and used by NSX-T for Service Insertion (Traffic Acquisition) |
Configure Raw Endpoint in Monitoring Session
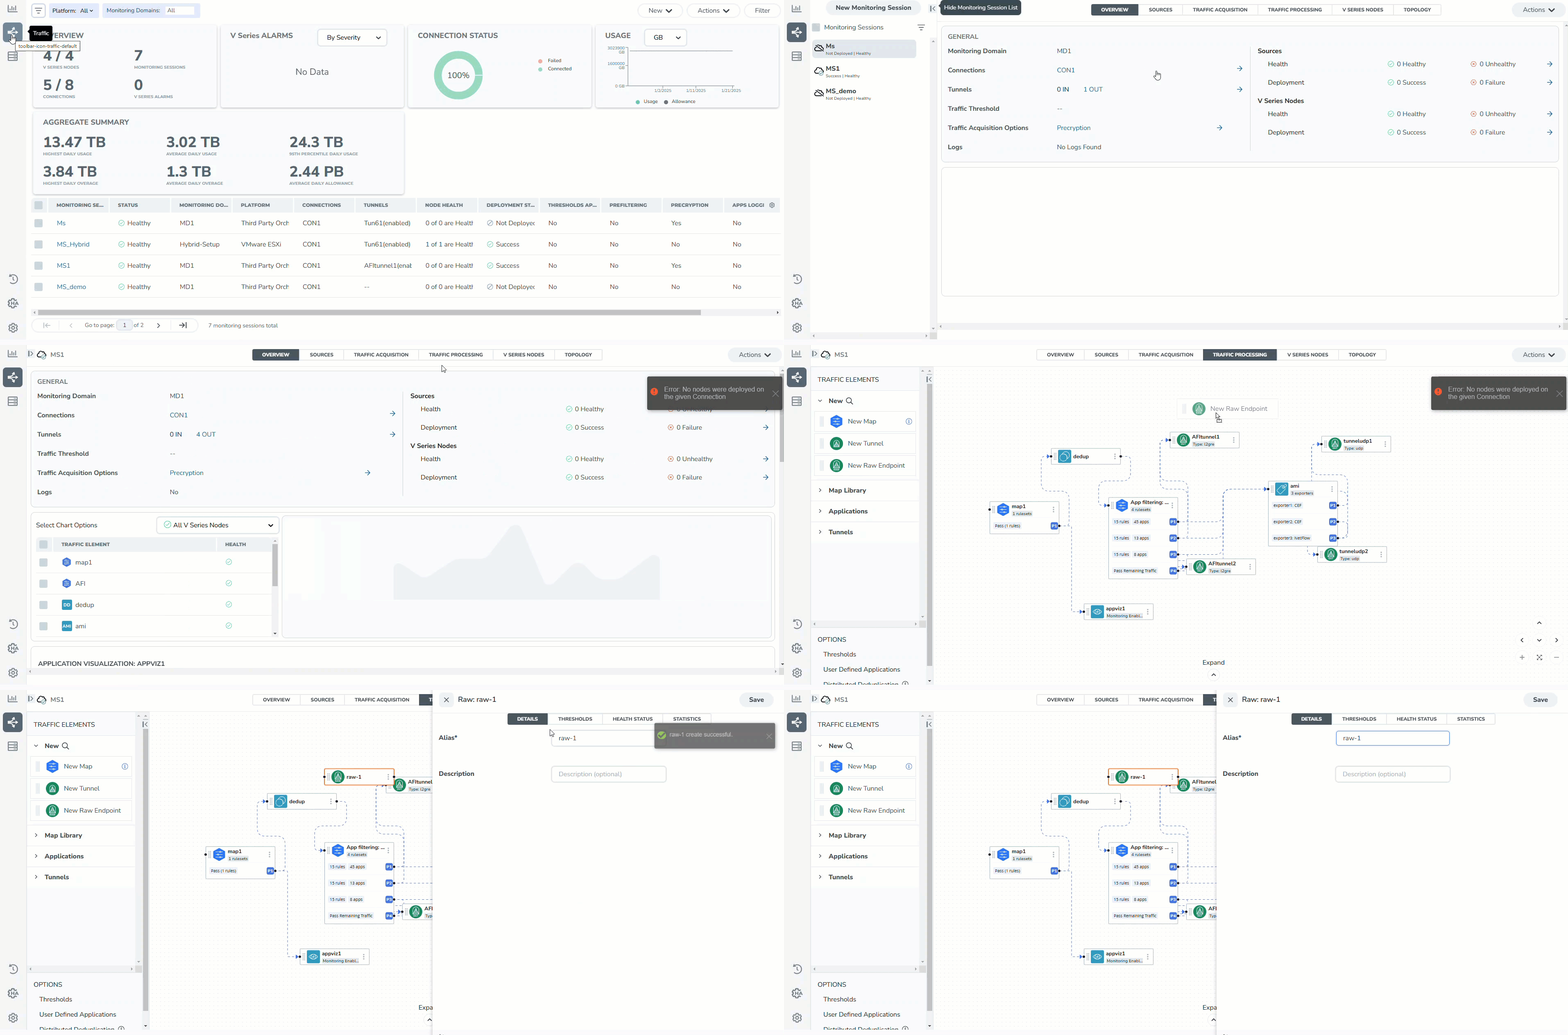
A Raw Endpoint (REP) passes traffic from a GigaVUE V Series Node interface. You can use it to ingest traffic from physical sources and optionally forward it to monitoring tools.
To add Raw Endpoint to the Monitoring Session:
-
Go to the graphical workspace.
-
From the New menu, drag New Raw Endpoint into the workspace.
-
Select the menu icon on the new endpoint and choose Details.
-
In the Raw quick view, enter an Alias and Description, then select Save.
-

- To deploy the Monitoring Session after adding the Raw Endpoint:
On the Traffic Processing page, go to the Actions menu and select Deploy.
In the Deploy Monitoring Session dialog, select the appropriate V Series Nodes.
For each node, map the correct interface (REP and TEP) using the drop-down menus.
Select Deploy.
- Select Export to download all or selected V Series Nodes in CSV and XLSX formats.
Configuration Support for Non IP-Addressable (l2 supported) Tools
You can configure to deliver RAW traffic to Layer 2 tools or sensors that do not support IP addressing.
To configure,
- Create a Virtual Standard Switch (VSS).
No uplink or physical NIC is required. - Create two port groups on the VSS:
-
EgressPortgroup: For the GigaVUE V Series Node to send RAW traffic.
-
IngressPortgroup: Enable promiscuous mode to mirror traffic to the sensor/tool.
Note: For details on creating a VSS and port groups, refer to Port Group Configuration for Virtual Machines section in the VMware Documentation.
- Connect the tool or sensor interface to IngressPortgroup.
NOTE:
Deploy the tool or sensor on the same ESXi host as the GigaVUE V Series Node.
Use Host-Based Deployment for the GigaVUE V Series Node. For details, refer to Deploy GigaVUE V Series Nodes using GigaVUE-FM
- Select EgressPortgroup as the tunnel interface (Network Adapter 2 or ens192) when deploying the node.
- In the Monitoring Session, select ens192 as the RAW interface during interface mapping as in the Create Raw Endpoint (VMware NSX-T).
Note: Promiscuous mode allows Port Group to mirror the entire switch traffic.


