Configure Application Intelligence Session
Application Visualization (earlier known as Application Monitoring) gathers the application statistics, and sends this information to GigaVUE-FM, which acts as an application monitor. The monitoring reports are sent to GigaVUE-FM through the destination port 2056. The application statistics appear as an array of monitoring reports that provide application-usage data in an easy-to-read graphical interface. This provides you with greater insight and control over how your network is being used and what applications are utilizing the most resources. To perform Application Monitoring, you must create the required application intelligence sessions on the nodes managed by GigaVUE-FM.
Prerequisites
- The environment on which the Application Intelligence solution is to be deployed must already be created and the nodes must be deployed on it.
- In virtual environment, the destination tunnels for the Application Filtering Intelligence Map must already be created.
Note: For Application Visualization and Application Metadata Intelligence, the destination(s) are defined internally by the solution.
Create an Application Intelligence Session in Virtual Environment
Complete the following prerequisites before creating an Application Intelligence solution in the virtual environment:
To create an Application Intelligence Session:
| 1. | On the left navigation pane, select Traffic > Solutions >Application Intelligence. |
| 2. |
Click Create New. The Create Application Intelligence Session page appears.
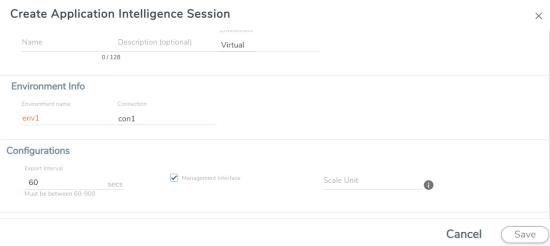 |
| 3. | In the Basic Info section, enter the name and description, and in the Environment select Virtual for the session to be created: |
Virtual- connects to the specific environment.
| 4. | In the Environment section, select the Environment Name, and the Connection Name. To create an Environment and connection, refer to Configure Environment . |
| 5. | In the Configurations section, complete the following: |
| a. | Select an Export Interval during which you want the Application Intelligence session to generate the reports for application visualization. The valid range is 60–900 seconds. |
| b. | Select the required interface. By default, Management Interface is enabled. To export the data through tunnel interface, uncheck the Management Interface check box. |
| c. | Enter a value for the Scale Unit. The scale unit represents the number of flows supported by the application. If the scale unit value is 1, the maximum active flow limit will be 100k. Refer to the following table for the maximum scale unit supported for VMware, AWS, and Azure platforms. Note: Scale Unit is not applicable for the OpenStack platform.
|
| 6. | In the Source Traffic section, select anyone of the following: |
| Source Selector‑ Select the source from the drop-down list box. To create new source, select New Source Selector and add the filters. For more information on creating a New Source Selector, refer to Create Source Selectors. |
Note: You cannot configure Source Selectors when you deploy the GigaVUE V Series Nodes using the Third Party Orchestration in VMware ESXi host.
| Tunnel Specification- Select the tunnel from the drop-down list box. To create new tunnel, select New Source Tunnel Spec and add the details for the tunnel. For more information on creating a new tunnel, refer to Create Tunnel Specifications. |
Note: Select the ens192 interface for the Tunnel Specifications from the drop-down menu when using third party orchestration.
| Raw End Point- Select the Raw End Point Interface from the drop-down menu which will trap the traffic for application monitoring. |
Note: This field is applicable only when you deploy your GigaVUE V Series Nodes using third party orchestration in VMware ESXi Host, Nutanix and Google Cloud Platform.
- Tunnel Specification for the source must always be configured with Traffic Direction as IN, to indicate that it is an ingress tunnel.
- For Azure Connection, VXLAN is the only supported Tunnel Type.
| 7. | Click Save. The session created is added in the list view. |
The total applications participating in the network traffic are displayed in the Application Intelligence Dashboard. For more information about the dashboard, refer to the View the Application Intelligence Dashboard.
Select the session from the Application Intelligence Sessions pane and click on the  icon and select View Details from the drop-down menu, to view the deployed G-vTAP Agents, their status and more information about source selectors, selected target.
If the session configuration is unsuccessful, troubleshoot the error notified (refer to
View the Health Status of a Solution). Click the Reapply all pending solutions button  in the dashboard to redeploy the configuration.
Note: GigaVUE-FM takes few minutes to display the application statistics.
Note: The option Reapply all pending solutions is applicable for physical solution only.
When the Application Intelligence solution is in suspended state, you cannot delete the session. You can click on the icon and select View Details from the drop-down menu, to view the details.
You can also filter the traffic based on the applications. For more information, see Application Filtering Intelligence.


