Tunnel Monitoring
A tunnel is a logical entity configured to establish secure connection across networks. Traffic is encapsulated at the sending end of the tunnel and decapsulated at the receiving end of the tunnel. GigaVUE-FM supports configuring various tunnel types. Refer to theTunnels section for details.
With the Tunnel Monitoring feature, GigaVUE-FM uses a tunnel discovery mechanism to identify the tunnels created across the managed nodes and clusters. The following tunnel types are supported in this release:
-
Embedded tunnels.
- Circuit-id tunnels
- L2GRE tunnels
- VXLAN tunnels
-
GigaSMART tunnels.
- GigaSMART L2GRE tunnel
- GigaSMART VXLAN tunnel
- Mixed Tunnels: Tunnel type on encapsulation end and decapsulation end can be either Embedded tunnel or GigaSMART tunnel.
The identified tunnels are logically grouped based on the following grouping criteria and listed in the Tunnel Monitoring page. The Tunnel Monitoring page provides a unified view of both ends of the tunnels created across the devices managed by GigaVUE-FM
| Tunnel Type |
Grouping Criteria |
| Embedded Tunnels |
|
| - Circuit-ID Tunnels |
|
●
|
Physical Connectivity discovered by GDP. |
Note: Physical connectivity is an optional parameter for grouping the circuit-id tunnels
|
| - L2GRE/VXLAN Tunnels |
|
| GigaSMART Tunnels |
|
| - L2GRE/VXLAN Tunnels |
|
During addition of nodes to GigaVUE-FM, the tunnels configured in the devices are automatically detected, logically grouped and added to the Tunnel Monitoring page. The tunnel logical group gets deleted during node deletion.
GigaVUE-FM identifies the tunnel related configuration changes during the config sync cycle and accordingly updates the tunnel logical groups in the Tunnel Monitoring page.
Note: For the tunnels listed in the tunnel monitoring page, you can identify the traffic drop at the decapsulation end of the tunnel by creating Alert Policies. Refer to the Traffic Drop Identification section for details.
Rules, Notes, and Limitations
Refer to the following Rules, notes and limitations:
-
The tunnel discovery mechanism identifies tunnels from the devices that are being managed by GigaVUE-FM.
The tunnels are identified irrespective of the device software version.
- GigaVUE-FM identifies tunnels configured between the physical devices.
Tunnels configured between the virtual nodes are not within the scope of this release.
- GigaVUE-FM detects tunnels that use 'Regular' maps for encapsulation and decapsulation.
- Circuit ID tunnels that are created manually will be discovered and monitored.
Circuit ID tunnels created as part of Fabric Map configurations are not within the scope of the Tunnel Monitoring page.
- For embedded tunnels (L2GRE/VXLAN), GigaVUE-FM detects the decapsulation configuration only when pass rule is configured with L2GRE/VXLAN Id on the maps at the decapsulation end.
View Tunnel Monitoring
To access the tunnel monitoring page:
- On the left navigation pane, click on

- Go to Physical > Tunnel Monitoring.
The list of tunnels are displayed.
| Field |
Description |
| Tunnel Logical Group Name |
Logical group name of the tunnel automatically generated by GigaVUE-FM. |
| Tunnel ID |
Tunnel Identifier |
| Source ID |
Host name or cluster Id (Cluster type) of nodes participating in tunnel encapsulation. |
| Destination ID |
Host name or cluster Id (Cluster type) of nodes participating in tunnel decapsulation. |
| Tunnel Type |
Type of tunnel. Can be:
|
●
|
Embedded (Circuit-Id, VXLAN, L2GRE) |
|
●
|
GigaSMART (VXLAN, L2GRE, ERSPAN - Decapsulation end) |
|
| Health Status |
Health status of the tunnel group. Displayed only if monitoring status is active. |
| Tunnel Discovery State |
Tunnel discovery state. Can be:
|
●
|
Complete: Tunnel has both encapsulating and decapsulating end |
|
●
|
Incomplete: Tunnel has only one end. |
|
| Monitoring Status |
Monitoring status of the tunnel, based on which the Health Status is displayed |
| Alert Policy Created |
Displayed as 'Yes' or 'No' based on Alert Policy created. |
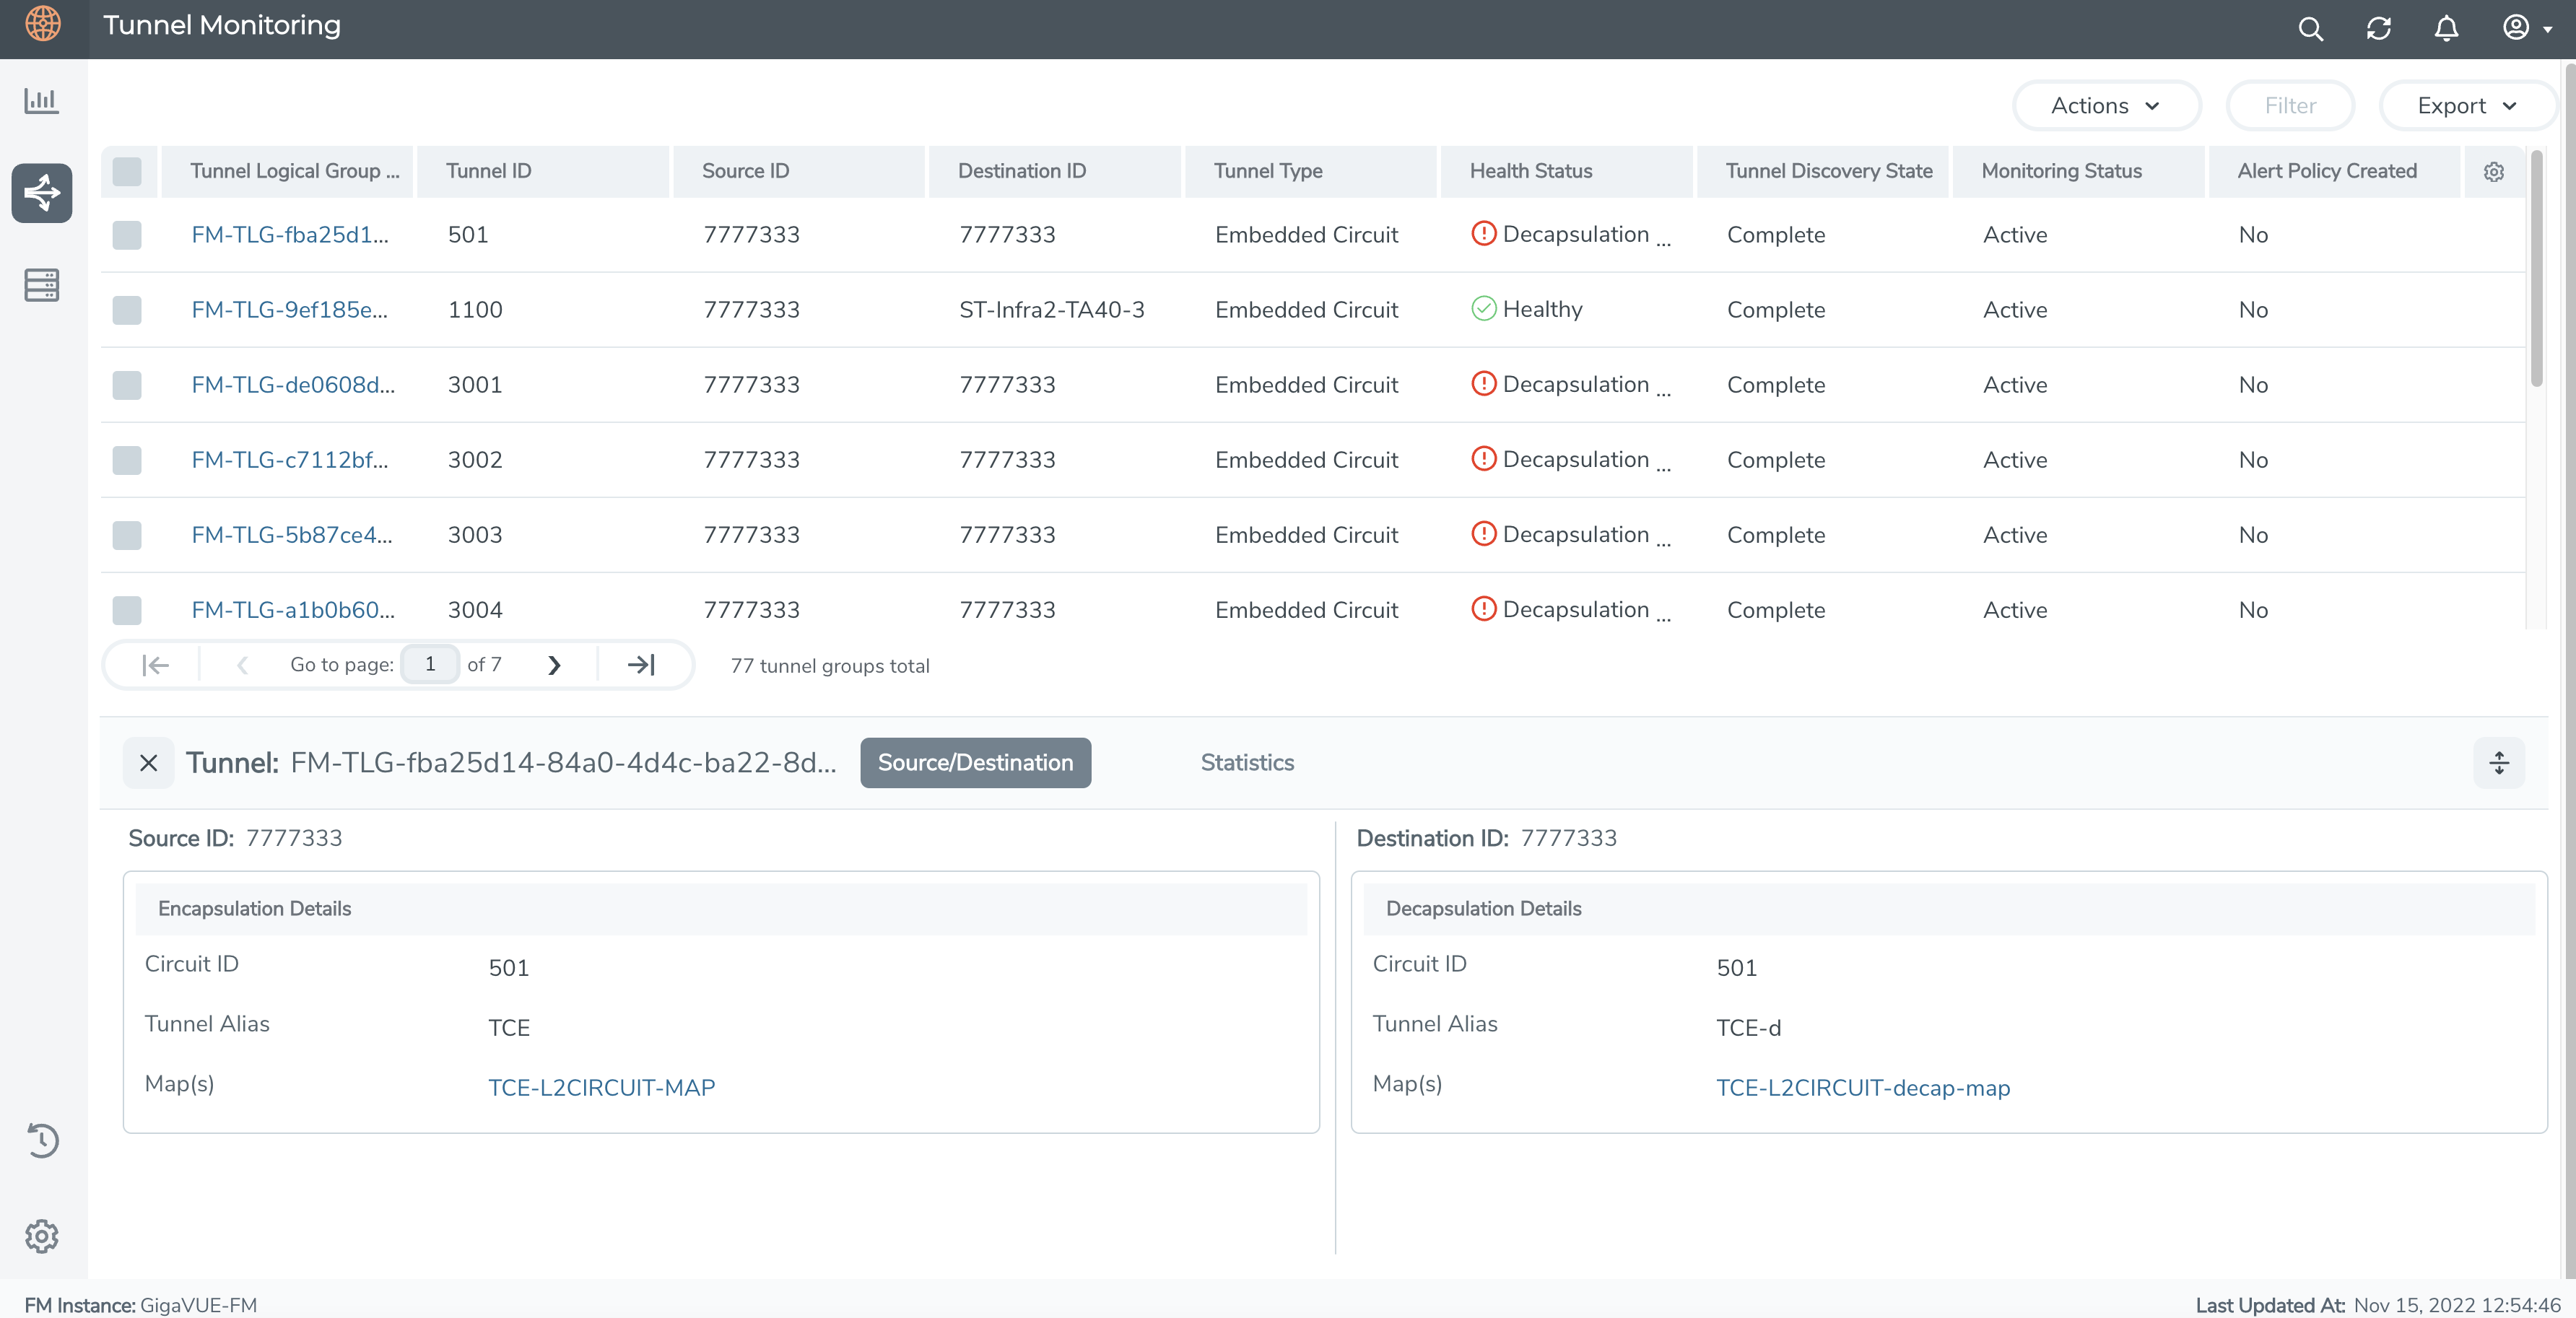
Click on a Tunnel Logical Group name to view the following details:
- Source/Destination: Displays the source and destination details of a tunnel logical group.
- Statistics: Displays the following statistical details about the tunnel logical group based on statistics collected by GigaVUE-FM during the last statistical poll cycle:
- Aggregated packets/octets Tx of encapsulation end.
- Aggregated packets/octets Rx of decapsulation end.
- Processed Traffic % displays the amount of packets received at the decapsulation end.
Use the following buttons to manage the displayed tunnels:
| Button |
Description |
| Actions |
Use the Actions drop-down button to activate and deactivate the selected tunnels.
To create Alert Policy for tunnels:
-
Select the required Tunnel Logical Group.
-
Click the Actions drop-down.
-
Click Create Alert Policy.
- Enter the required details.
Note: You can create Alert Policies only if the Tunnel Discovery State is 'Complete'.
Refer to the Traffic Drop Identification section for details.
|
| Filter |
Use to filter the Tunnels based on the following criteria:
|
| Export
|
Use to export the tunnels (either all or the selected tunnels) in CSV or XLSX format. |


