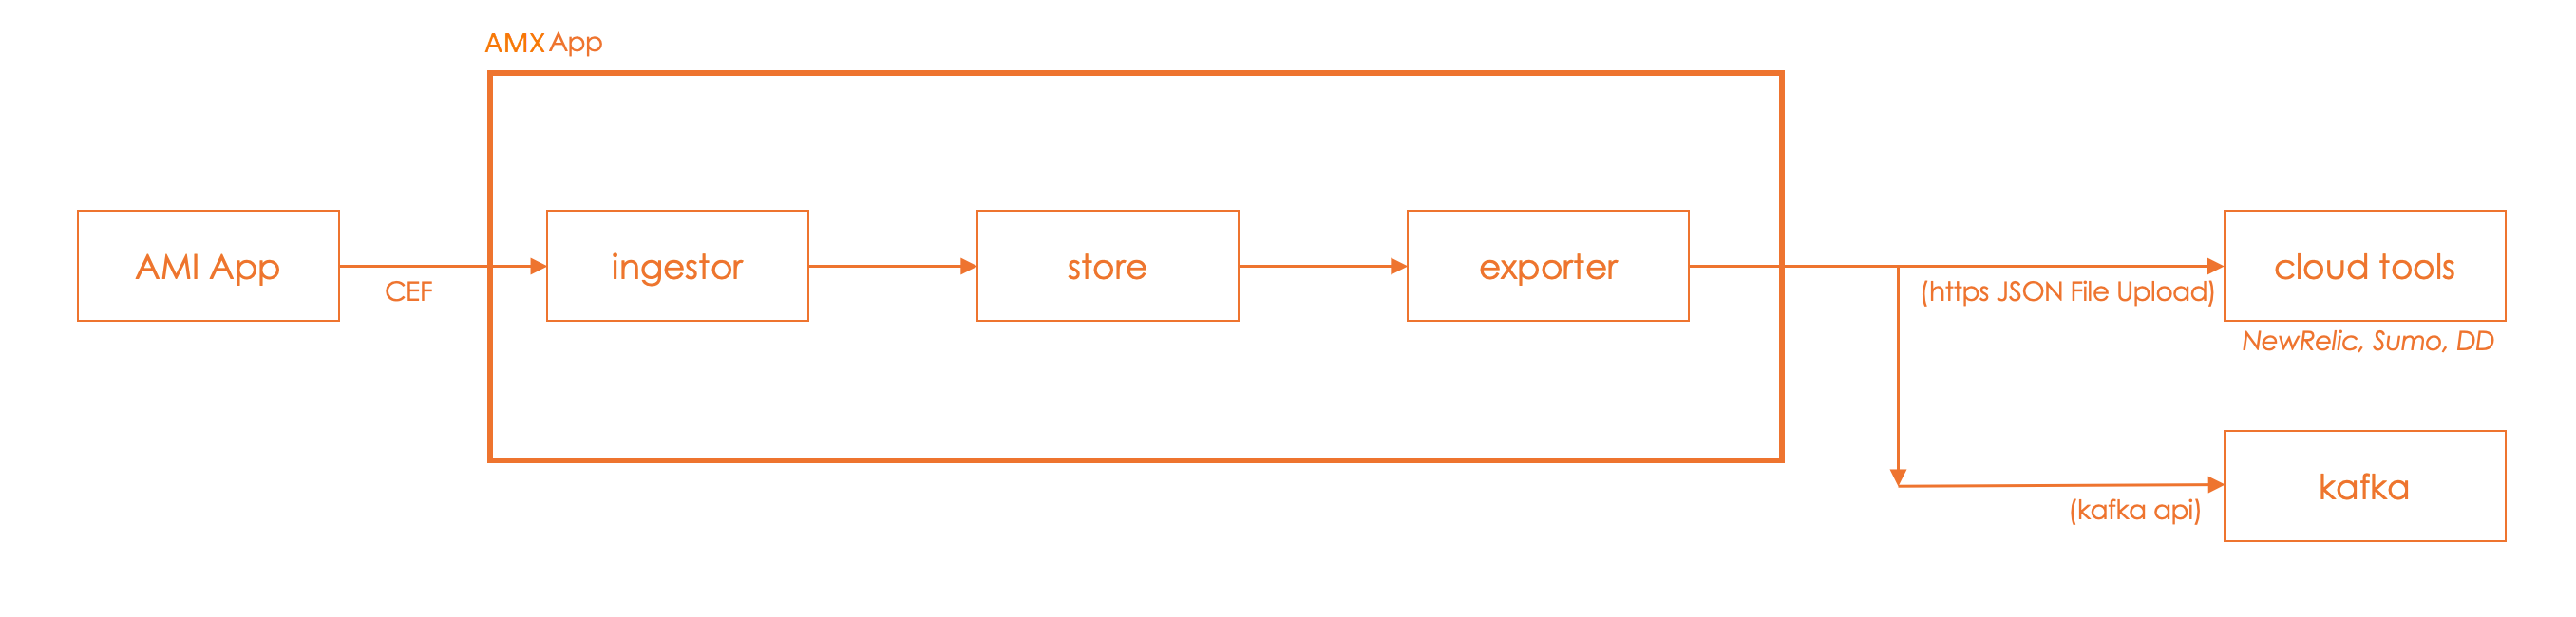
Application Metadata Exporter
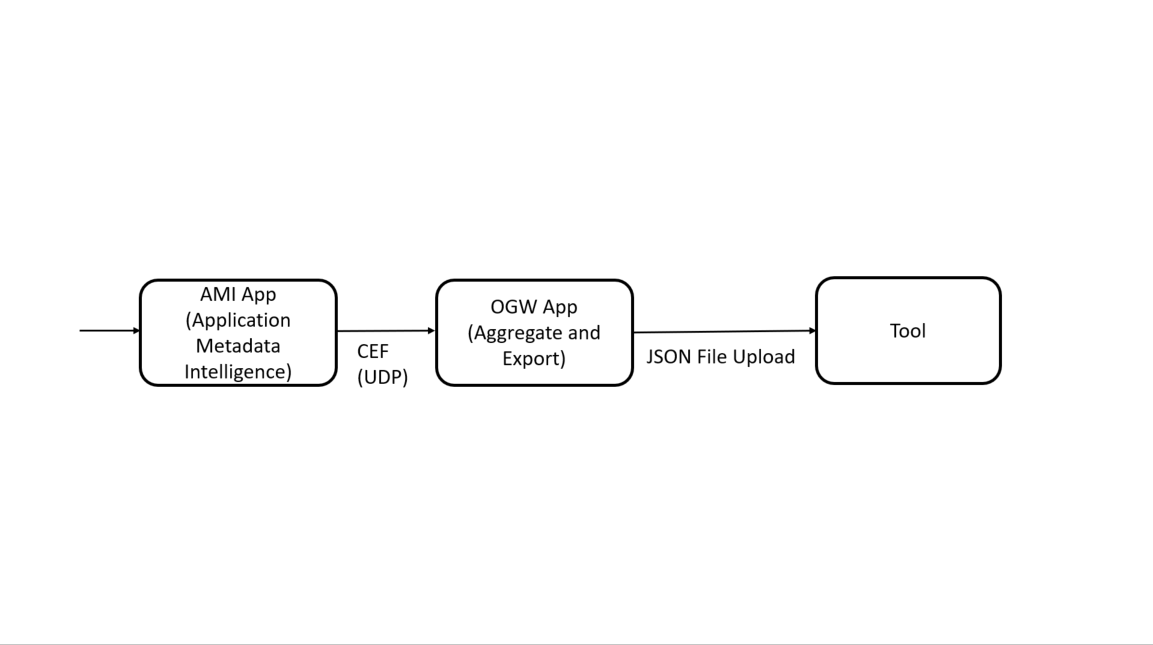
The
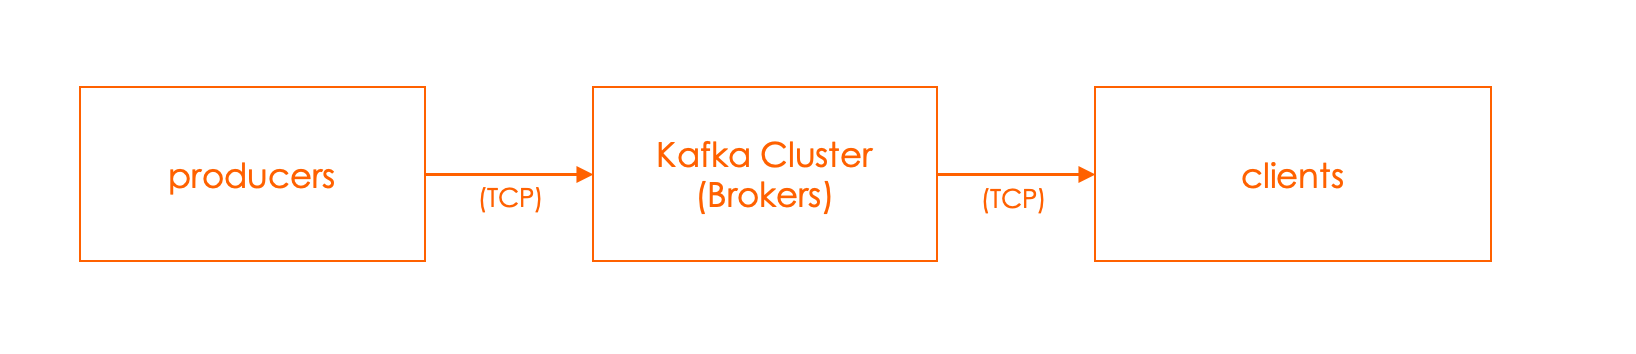
Kafka Export
The Kafka export can be used to ingest AMI data on on-prem tools or data warehouse.
To configure an
| Step No | Task | Refer the following topics |
|---|---|---|
|
1 |
Create a Monitoring Domain |
Create Monitoring Domain topic in the respective GigaVUE Cloud Suite Configuration Guides. |
|
2 |
Deploying GigaVUE V Series Node Note:
|
Configure GigaVUE Fabric Components in GigaVUE‑FM topic in the respective GigaVUE Cloud Suite Configuration Guides. |
|
3
|
Note: This V Series Node is used for creating Application Intelligence Session.
|
Configure Application Intelligence Solutions on GigaVUE V Series Nodes topic in the respective GigaVUE Cloud Suite Configuration Guides. |
|
4 |
Add Application Metadata Intelligence Session |
Create Metadata Intelligence by Editing Monitoring Session from Dashboard |
|
5 |
Create a Monitoring Session |
Create Monitoring Session topic in the respective GigaVUE Cloud Suite Configuration Guides. |
|
6 |
Add Applications to the Monitoring Session |
Add Application to the Monitoring Session topic in the respective GigaVUE Cloud Suite Configuration Guides. |
|
7 |
View Monitoring Session Statistics |
View Monitoring Session Statistics topic in the respective GigaVUE Cloud Suite Configuration Guides. |
AMX Application Deployment
| Hardware |
| Virtual (VMware) |
On-Premises
Hardware
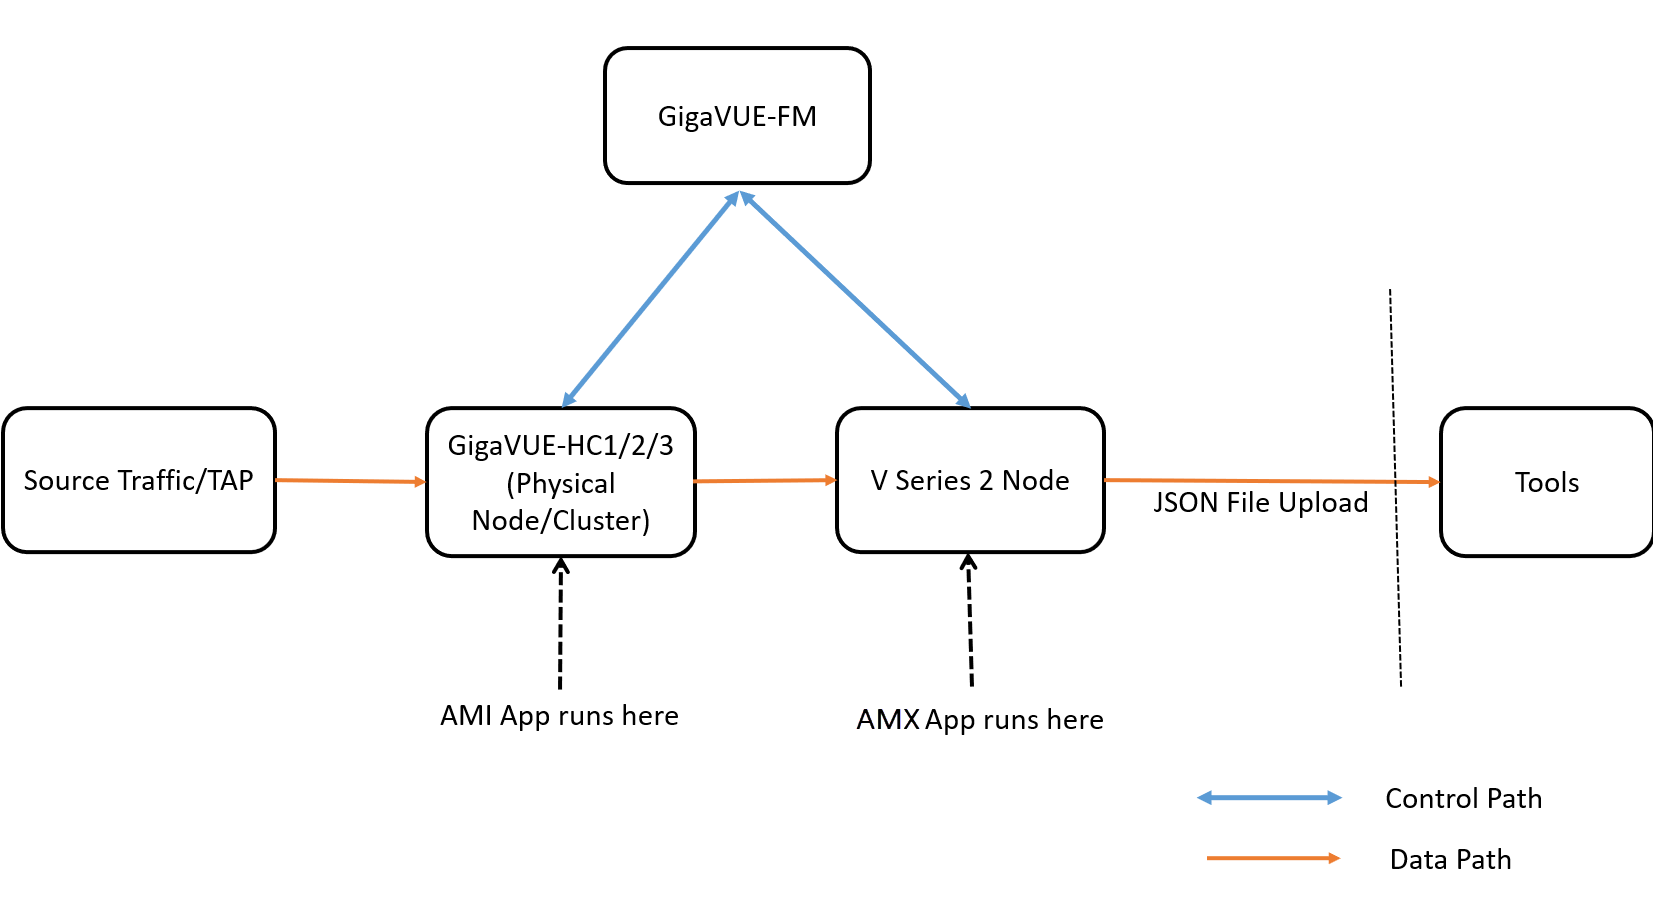
In hardware deployments, the Application Metadata Intelligence (AMI) runs on a physical node/cluster, and the
- GigaVUE-HC1
- GigaVUE-HC2
- GigaVUE-HC3
- GigaVUE‑HC1-Plus
Private Cloud (VMware)
In the Private Cloud environment, the application is supported only on VMware and can be deployed in the VMware as shown in the diagram.
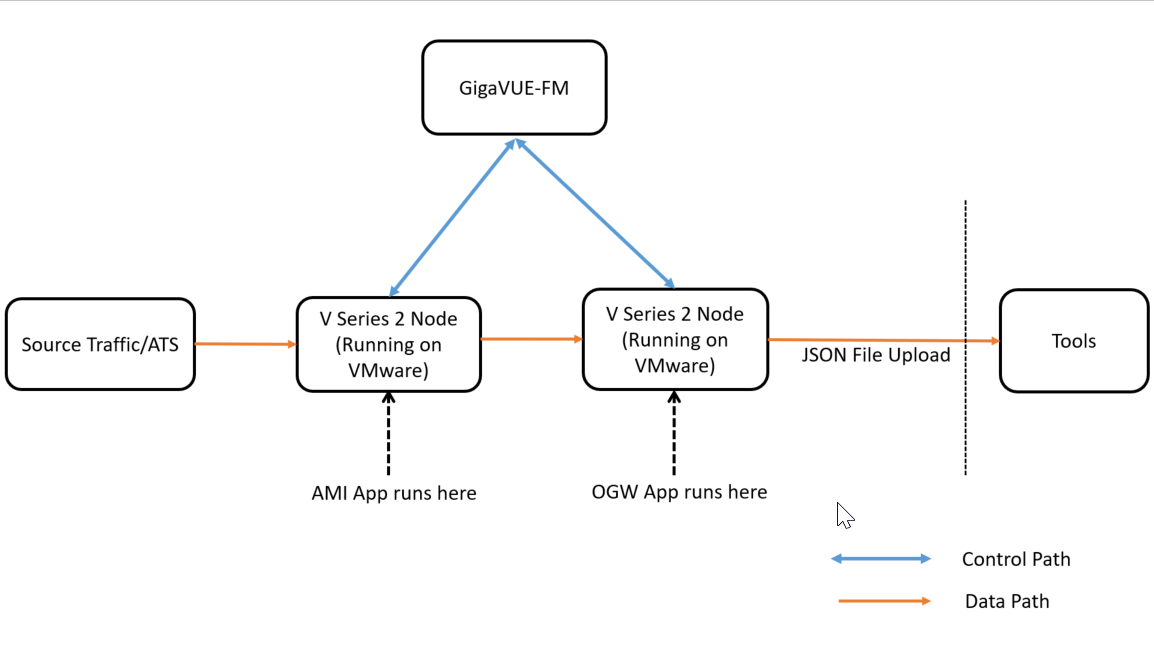
Note: The application is not supported on Nutanix or OpenStack environment.
Public Cloud
In the Public Cloud environment, the application is supported on AWS and Azure platforms, and can be deployed as shown in the diagram: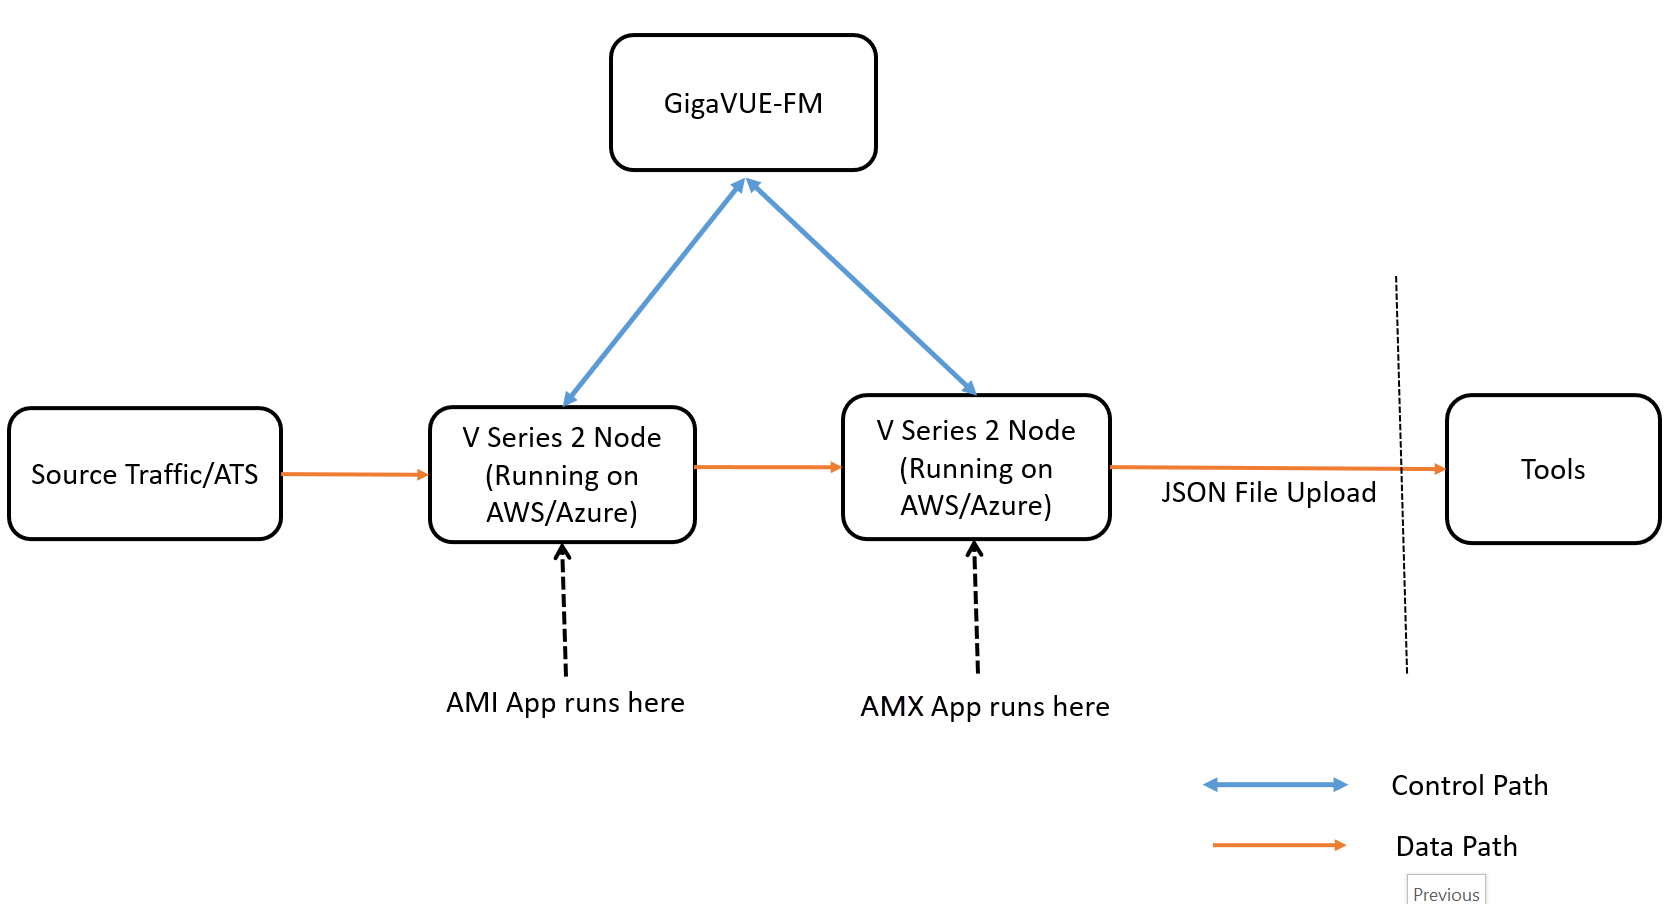
Rules
- After deploying the GigaVUE V Series Node in the monitoring domain, click on the GigaVUE V Series Node's Name, and the V Series Node quick view opens. Choose a data IP to which you wish to send CEF packets, then use the IP address of this data IP as the Tool IP Address when creating the Application Metadata Intelligence solution. Refer
to Create Metadata Intelligence by Editing Monitoring Session from Dashboard
topic in the GigaVUE Fabric Management Guide on how to configure AMI for
- The GigaVUE V Series Node deployed must be entirely dedicated to the
- When multiple connections are configured under the same monitoring domain using third party orchestration, ensure to select the connection alias in which the AMX application is deployed, when deploying monitoring session.
- When multiple connections are configured under the same connection resource using third party orchestration, ensure to select the connection alias in which the Application Intelligence session is configured, when configuring Application Intelligence Session.
- When using this application for production usage, it is recommended to use large size Virtual Machines.
Prerequisites for AWS
Prerequisites to follow when creating a monitoring domain and deploying a V Series node:
- Select Traffic Acquisition Method as None. Refer Create a Monitoring Domain for more detailed information on how to create a monitoring domain.
- Select Instance type with three or more NICs. Refer Configure and Deploy GigaVUE Fabric Components in GigaVUE-FM for more detailed information on how to deploy a GigaVUE V Series Node.
- When the Traffic Acquisition Method is selected as None, the Volume Size field appears on the AWS Fabric Launch Configuration page. Enter the Volume Size as 80GB.
Note: Check on the disk space run every 30 minutes and when the disk space reaches 50%, purge starts.
Prerequisites for Azure
Prerequisites to follow when creating a monitoring domain and deploying V Series node:
- Select Traffic Acquisition Method as None. Refer Create Monitoring Domain for more detailed information on how to create a monitoring domain.
- Select Size with three or more NICs. Refer Configure GigaVUE Fabric Components in GigaVUE-FM for more detailed information on how to deploy a GigaVUE V Series Node.
- When the Traffic Acquisition Method is selected as None, the Disk Size field appears on the Azure Fabric Launch Configuration page. Enter the Disk Size as 80GB.
Note: Check on the disk space run every 30 minutes and when the disk space reaches 50%, purge starts.
Prerequisites for VMware
Prerequisites to follow when creating a monitoring domain and deploying V Series node:
- Select Traffic Acquisition Method as
- .
Configure Application Metadata Exporter Application
Rules to follow when using the
The monitoring session can only have Raw End Point (REP), it cannot have other applications, maps, or tunnels when using the
To add
- Drag and drop
- Enter the Alias for the application.
-
Fields
Description
Alias
Enter the alias name for the cloud tool export.
Cloud Tool
Select the Cloud tool from the drop-down menu.
Account ID
Enter the account ID number of the selected Cloud Tool.
API Key
Enter the API key of the Cloud Tool.
Enable Export
Enable the box to export the Application Metadata Intelligence output in JSON format.
Zip
Enable the box to compress the output file.
Note: Enable this field when using New Relic as the cloud tool.
Interval
The time interval (in seconds) in which the data should be uploaded periodically. The recommended minimum time interval is 10 seconds and the maximum time interval is 30 minutes.
Parallel Writer
Specifies the number of simultaneous JSON exports done.
Export Retries
The number of times the application tries to export the entries to Cloud Tool. The recommended minimum value is 4 and the maximum is 10.
Maximum Entries
The number of JSON entries in a file. The maximum number of allowed entries is 5000 and the minimum is 10, however 1000 is the default value.
Labels
Click Add. Enter the following details:
o Enter the Key . o Enter the Value. Note: When New Relic is selected as the cloud tool, the key is automatically set as is eventType and the Value can only have alphanumeric characters, colons ( : ), periods ( . ), and underscores ( _ ).
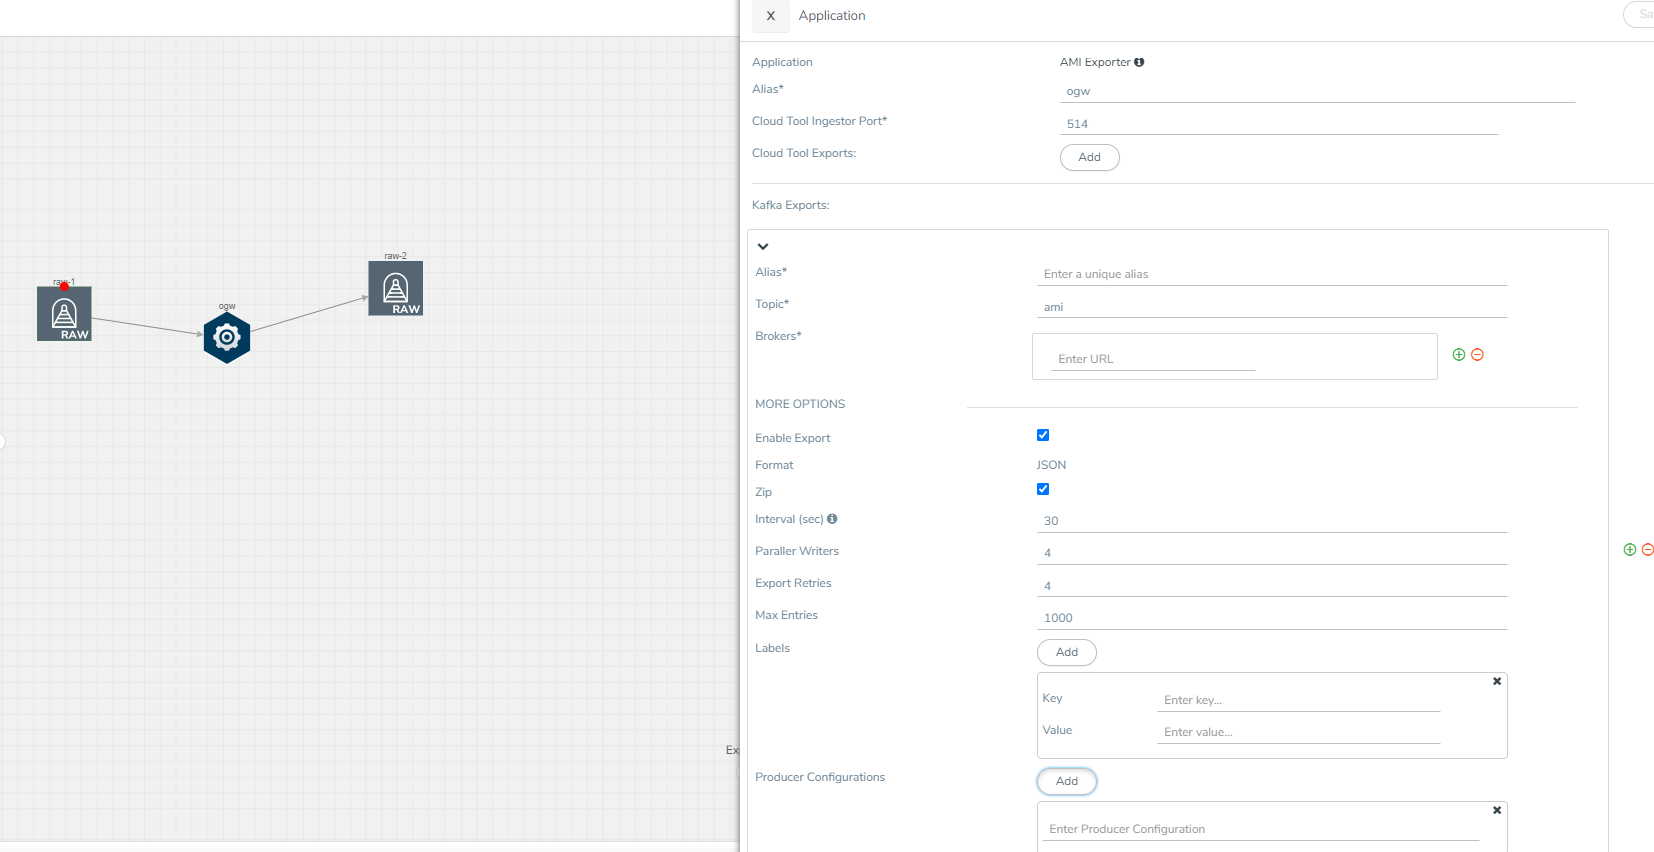
Enter the following details for Kafka export in the Application quick view:
Fields
Description
Alias
Enter the alias name for the Kafka Export.
Topic
The topic name to push JSON streams to, which is generally given to users part of the Kafka administration Brokers
The URL that contains the Kafka cluster endpoints. Click  to add another broker and click
  to remove an existing broker.
Enable Export
Enable the box to export the Application Metadata Intelligence output in JSON format.
Zip
Enable the box to compress the output file.
Interval
The time interval (in seconds) in which the data should be uploaded periodically. The recommended minimum time interval is 10 seconds and the maximum time interval is 30 minutes.
Parallel Writer
Specifies the number of simultaneous JSON exports done.
Export Retries
The number of times the application tries to export the entries to Kafka. The recommended minimum value is 4 and the maximum is 10.
Maximum Entries
The number of JSON entries in a file. The maximum number of allowed entries is 5000 and the minimum is 10, however 1000 is the default value.
Labels
Click Add. Enter the following details:
o Enter the Key. o Enter the Value. Producer Configurations Click Add to enter the authentication details if a Kafka broker needs authentication.
For Example:
- security.protocol=SASL_SSL
- sasl.mechanism=PLAIN
- sasl.username=username
- sasl.password=password
- Click Deploy to deploy the monitoring session. The Select nodes to deploy the Monitoring Session dialog box appears. Select the GigaVUE V Series Node for which you wish to deploy the monitoring session.
- After selecting the V Series Node, select the interfaces for the REPs deployed in the monitoring session from the drop-down menu. Then, click Deploy.
Note: If you reload the GigaVUE V Series Node after configuring the AMX application, then the Ingestor in the AMX application fails.
The monitoring session configuration health can be viewed on the Monitoring Session page. Refer Cloud Health Monitoring - Configuration Health Monitoring for more detailed information on how to view cloud configuration health.
To view the application statistics on the Monitoring Session Statistics page, click View Monitoring Session Diagram and click on the


