Most Utilized Traffic
The Most Utilized Traffic widget allows you to view the ports with highest percentage utilization. These ports can belong to a specific site or all sites. The highest percentage utilization is displayed over the selected period. The period can be 1 hour, 1 day, 1 week, or 1 month to view the utilization percentage.
The Most Utilized Traffic widget lists the ports with the node ID, port number, port alias, and the utilization percentage. The most utilized traffic percentage is displayed as either a table or a bar graph. By default, a table is displayed. You can click the arrow to change the display to a graph as shown in Figure 946: Most Utilized Traffic Widget.
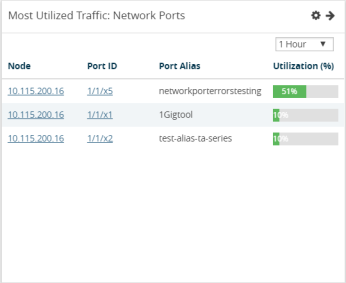
Figure 946: Most Utilized Traffic Widget
To configure the Most Utilized Traffic widget:
1Click Dashboard on the top navigation link.
|
1.
|
On the Physical & Virtual dashboard page, select the profile in which you want to add the widget. |
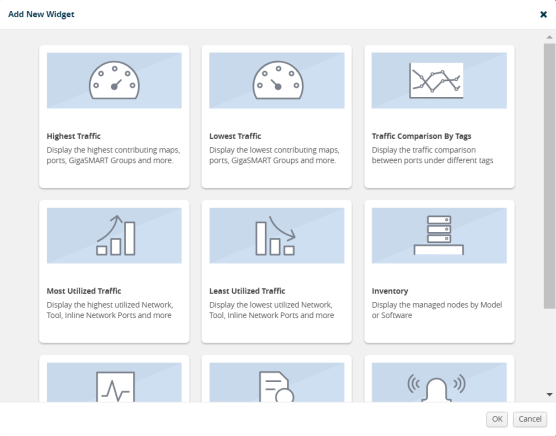
Figure 947: Add New Widget
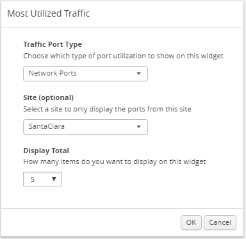
Figure 948: Most Utilized Traffic Configuration
|
4.
|
From the Traffic Port Type drop-down list, select one of the following port types: |
|
5.
|
(Optional) From the Site drop-down list, select a site to display the utilization percentage of the ports associated to the site. |
|
6.
|
From the Display Total drop-down list, select the number of items to be displayed. By default, the number of items selected for display is 5. |


