Lowest Traffic
The Lowest Traffic widget lists the physical maps, fabric maps, ports, and GigaSMART that contribute to the lowest traffic within a specified time. You can create as many Lowest Traffic widgets as you want listing up to 5, 10, 15, 20, 50, or 100 items in each widget.
The traffic flowing through a port or a map rule is measured in megabytes per second (Mbps). You can specify the period over which the amount of traffic is calculated. The period can be 1 hour, 1 day, 1 week, or 1 month.
The physical maps and ports can be displayed as either a table or a graph. By default, a table is displayed. You can click the arrow to change the display to a graph as shown in Figure 940: Lowest Traffic.
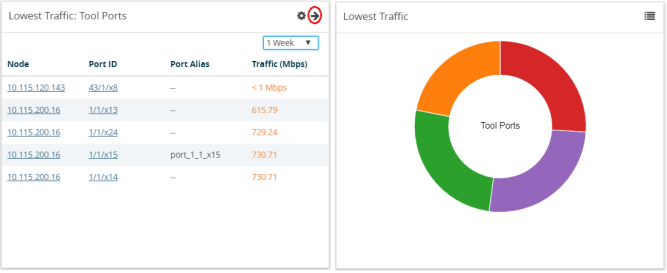
In the graph view, each ring represents a map or a port. You can hover your mouse over the graph to view the percentage of traffic flowing through the map or the port.
The Lowest Traffic widget is configured exactly the same way as the Highest Traffic widget. To configure the Lowest Traffic widget, refer to the configuration steps provided in Highest Traffic . In step 4, select Lowest Traffic and click OK. The Lowest Traffic configuration window is displayed.


