Dashboard
When you first login to GigaVUE-FM, the Dashboard - Physical & Virtual page is displayed by default as shown in Figure 365: GigaVUE-FM Home Page.. You can navigate to Health Monitor or Traffic Analyzer Dashboards from the left navigation pane.
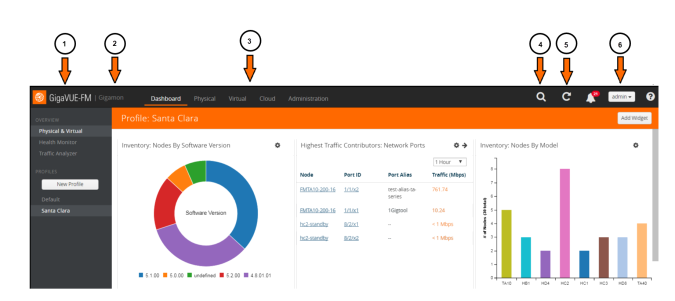
Figure 365: GigaVUE-FM Home Page.
1 - Click on GigaVUE-FM to return to the Dashboard
2 - Customized GigaVUE-FM instance title
3- Top navigation links
4 - Search
5 - Refresh
6 - Click to upgrade, change the password and logout
Table 1: Summary of Dashboard Navigation provides descriptions of the top navigation links and the left navigation pane in GigaVUE-FM.
|
Top Navigation Links |
Left Navigation Pane |
|
Dashboard |
|
|
Physical & Virtual —Displays the informational widgets for the physical and Virtual nodes. |
|
|
Health Monitor—Displays information about GigaVUE-FM such as CPU usage, amount of storage used and available. |
|
|
Traffic Analyzer—Displays the FabricVUE Traffic Analyzer, which provides traffic flow patterns based on FabricVUE Traffic Analyzer. This dashboard displays information only when NetFlow is enabled on the port or port under observation. |
|
|
Profiles—Allows you to create and view the profiles. A profile allows you to create a customized dashboard to monitor the physical and virtual nodes. |


