View the Flow Summary and Statistics
A flow can display all maps that are created for managing the packet distribution in the GigaVUE nodes. A flow summary provides information only about the total number of maps and ports participating in the flow along with the total number of unhealthy maps and ports in the flow. You can also select multiple maps and view the statistics to check how exactly the packets are flowing.
To view the flow summary:
| 1. | Follow steps 1 to 3 as described in View Flows. |
| 2. | In the Flows page, click a flow that you want to view. Alternatively, select a flow and click Actions > Open Flow. The flow view page is displayed. |
The following table describes the information provided in the Summary tab:
|
Option |
Description |
|
Related Ports |
Total number of ports participating in the flow. Click the Related Ports link to view the related ports in the flow. Refer to View Total Ports. Note: V ports and GigaSMART ports are not considered. |
|
Unhealthy Ports |
Total number of related ports that are unhealthy. If there are unhealthy ports, click the Unhealthy Ports link to view the related ports that are unhealthy. Refer to View Total Unhealthy Ports. To know more about how the health of a port is calculated, refer to Port Health Status. |
|
Related Maps |
Total number of maps participating in the flow. Click the Related Maps link to view the related maps in the flow. Refer to View Total Maps. |
|
Unhealthy Maps |
Total number of related maps that are unhealthy. If there are unhealthy maps, click the Unhealthy Maps link to view the related maps that are unhealthy. Refer to View Unhealthy Maps. To know more about how the health of a map is calculated, refer to Map Health Status. |
| 3. | To view the statistics, select the maps. To select the maps, follow one of the following methods: |
Method 1:
| a. | Click on a map. A list of priority maps are displayed. Refer to 2 Selecting Maps From Maps List. |
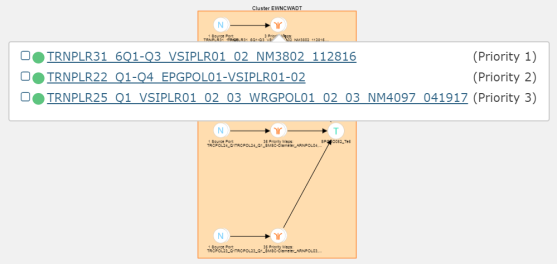
| 2 | Selecting Maps From Maps List |
| b. | Click the check box next to the priority map. The selected map is displayed in the Items Selected pop-up. Refer to 3 Selected Maps in Items Selected Pop-up. |
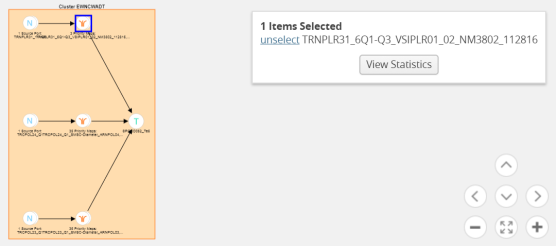
| 3 | Selected Maps in Items Selected Pop-up |
| c. | Repeat step a and b for selecting multiple maps. |
Method 2:
| a. | In the flow view page, double-click on a map. A list of priority maps are displayed. Refer to 4 List of Priority Maps. |
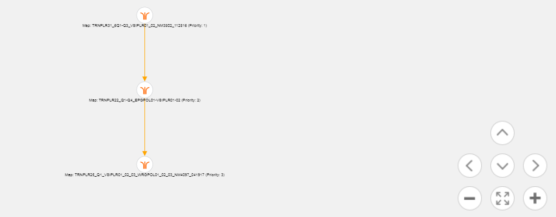
| 4 | List of Priority Maps |
| b. | Click on a map. The map is selected and is simultaneously displayed in the Items Selected pop-up. Refer to 5 Maps Selected. |
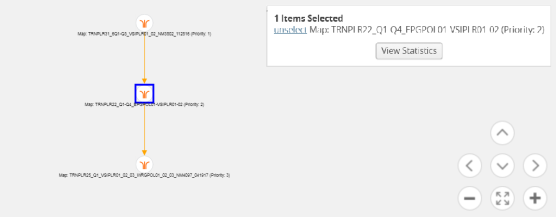
| 5 | Maps Selected |
| c. | Repeat step b to select multiple maps. |
| 4. | In the Items Selected pop-up, click View Statistics. Alternatively, select the Statistics tab and click View Statistics. The Statistics tab displays a graph to show how the packets are flowing from the selected maps. |


