Reports
The Reports option allows you to download the data in the dashboards and visualizations in PDF or PNG format.
Note: You can download data in .csv format from the Discover page.1
To download the reports
- On the left navigation pane, click on
 .
. - Select Analytics
- Click on a report to view the details and download the report.
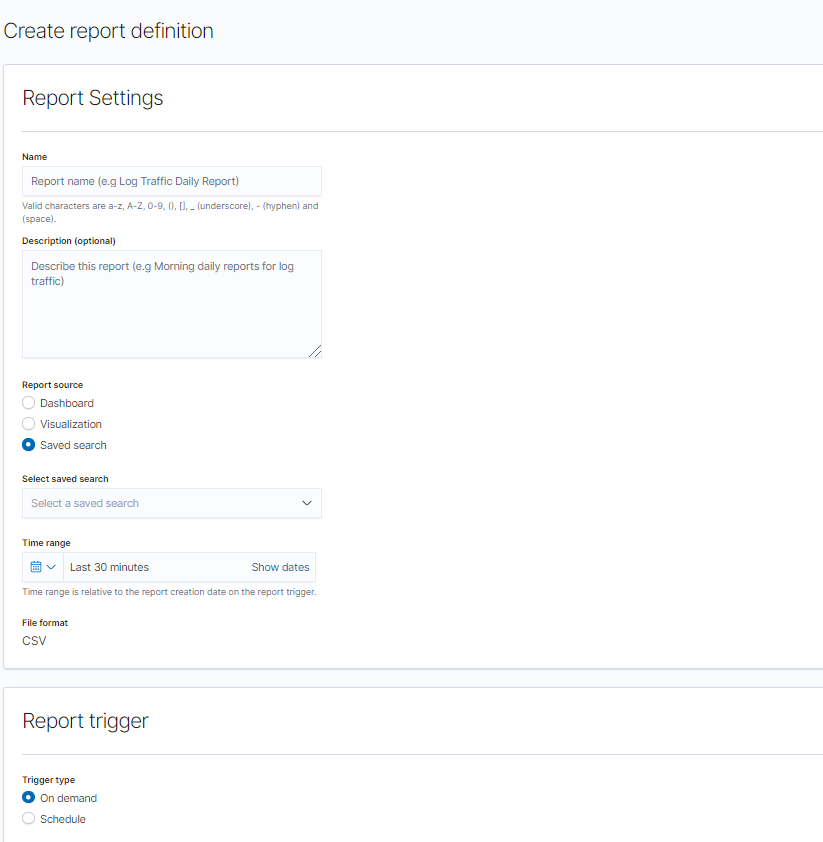
The Report Definitions option allows you to schedule automatic generation of reports. To create report definition:
- Click Create.
- Select or enter the following details under Report Settings:
- Select or enter the following details under Report trigger:
- Trigger type
- On Demand
- Schedule
- Request time
- Recurring: Select Frequency and the Request time.
- Cron-based: Select the Custom cron expression.
- Select the required time zone.
- Click Create.
| Field | Description |
|---|---|
| Name | Name of the report. |
| Description | Description for the report. |
| Report Source | The report source from which the report is generated. It can be Dashboard, Visualization or a Saved Search object. |
| Select |
Select your Dashboard, Visualization or the Saved Search object, accordingly. Dashboards and Visualizations will be downloaded in PNG or PDF format. Saved search objects will be downloaded in CSV format. |
| Time Range | Select the time range for your report. |
| File Format | Select the required file format. |
| Header and Footer | Add a header or footer for the report. Headers and footers are only available for dashboard or visualization reports. |


