Discover
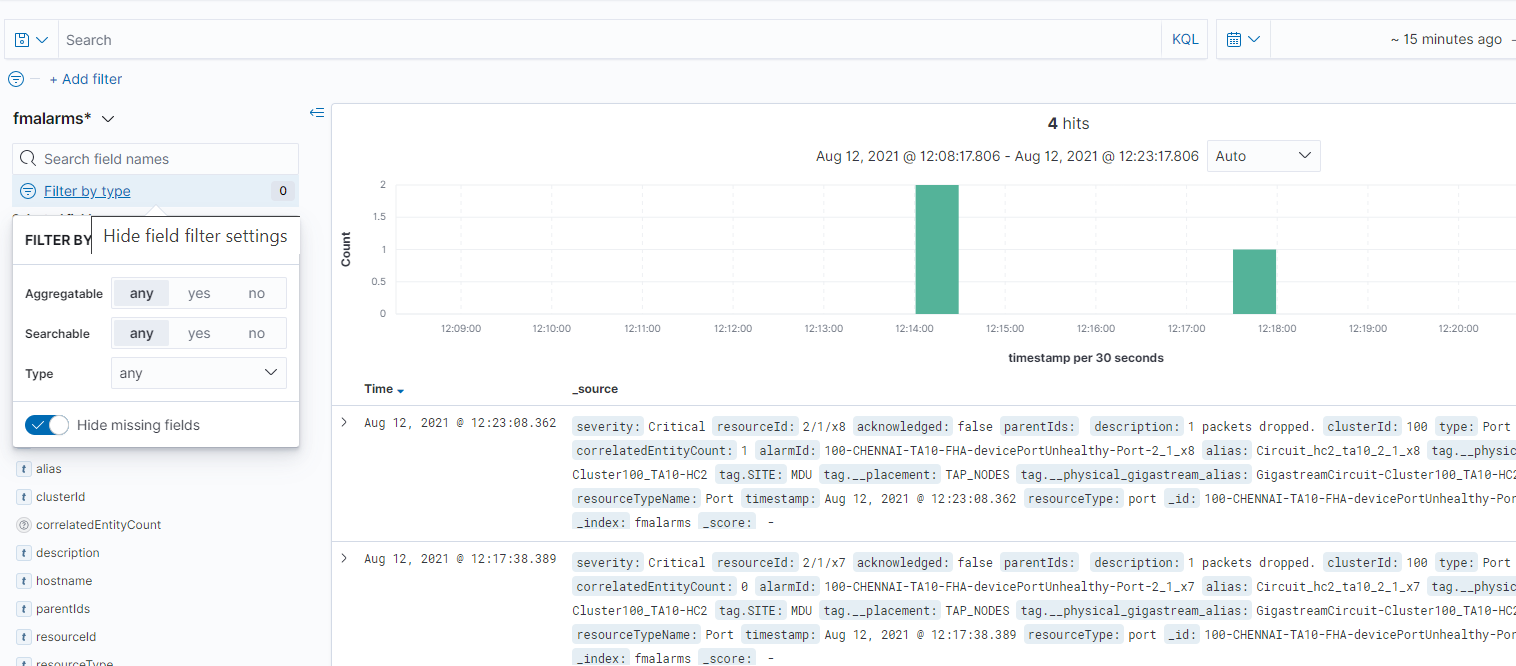
The Discover page allows you to view and explore your data, and consists of the following sections:
- Add filters: Use to create queries and filters. Click Add filters to add a filter. You can also use time filters along with the filter created. Use the saved filters in dashboards and visualizations. Refer to the Add Filter section for details.
- Date Histogram: Displays how data is ingested over time.
- Documents: Displays the documents. Expand the documents to view more details.
- Field list on the left: Displays fields available in the data. Click on a field to view the most common values.
The Filter by Type option allows you to filter the data based on the following criteria:
| Aggregatable | Select Yes to extract summaries from matching documents. For example, count is a type of aggregation. |
| Searchable | Select Yes to filter the data based on specific conditions. For example, filter the data for the last 24 hours. |
| Type |
Field type. Allowable values are: |
You can perform the following operations from the Discover page:
| New |
Use to create a new saved search object. |
| Save | Use to save your search and use it later. You can also generate a CSV report or use the saved search object in dashboards and visualizations. Refer to Save Search section for details. |
| Reporting | Use to generate and download the report in CSV format. |
| Open | Use to open the list of existing saved search objects. |
| Share | Use to share the saved search object to other users. |
| Inspect | Use to view details such as number of hits, index pattern, index pattern id, request and response details. |
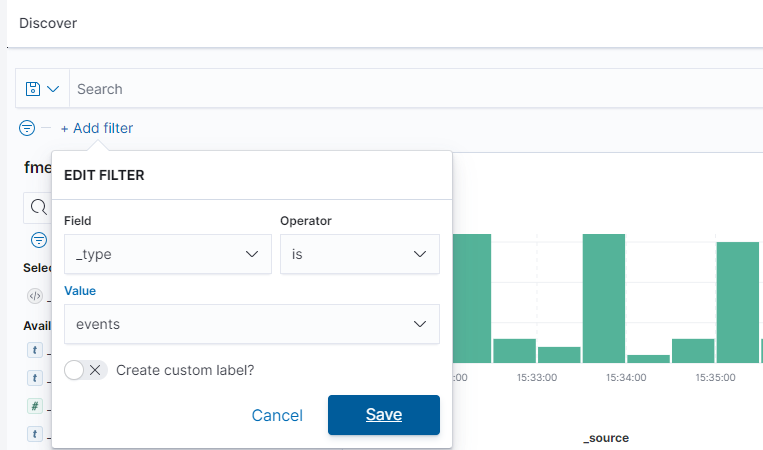
Add Filter
To add a filter:
- Click Add filter. The Edit Filter pop-up appears.
- Select the required field, the operator, and the value.
- Click Save to save the filter.
- You can create custom label for the filter.
Save Search
Use the Save Search option to save queries, filters, and current view of the Discover page, such as the columns selected in the Document table, the sort order and also the index pattern. To save a search:
- Create a search criteria that you want to reuse, click Save in the toolbar.
- Enter a name for the search and click Save.
- Use the saved search objects in the dashboards and visualizations by selecting the search objects using the Add from library option.
Find Data
Use the Discover page to find the data you need to analyze. You can also specify the time range in which to view that data:
- On the left navigation pane, click on
 .
. - Select Analytics
- Select the index patterns for which you want to find the data. For example, fmalarms.
- Adjust the time range to view the data for the required time range.
- To view the count of data for a given time in the specified range, click and drag the mouse over the histogram.
Note: The range selection is based on the default time field in your data. If the data does not have a time field, the range selection is not available.


