Display Port Statistics
From the Ports page, you can view the port statistics for either of the following:
| A single port. Refer to Display Port Statistics for a Single Port |
| All the ports. Refer to Display Statistics for All Ports |
Display Port Statistics for a Single Port
From the Ports > Ports > All Ports, select any port by clicking on the row. The quick view window that appears provides port statistics for that particular port. Each field is color-coded in the graphical representation.
By hovering over the graph, numerical value for each of the data points is visible as shown in 1.
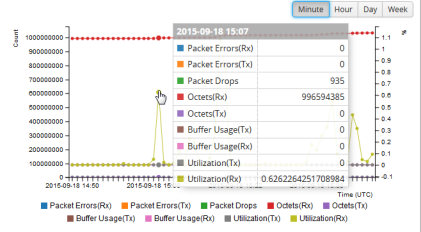
| 1 | Numerical Values for Data Points on the Statistics Graph |
Note: GigaVUE-FM will display 9-11 data points in the graph.
You can modify the time lapse for measuring various data points by selecting the Minutes, Hour, Day, or Week button. 2 shows the data points measured by hour.
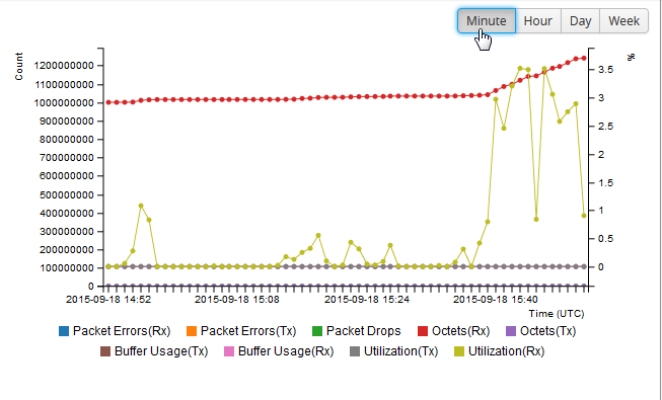
| 2 | Numerical Values for the Data Points Measured by Hour |
Table 3: Port Statistics Definitions describes the port statistics available.
|
Counter |
Definition |
Notes |
||||||||||||
|
Packet Errors |
Total Error Packets Received or Transmitted This indicates hardware detected errors. Error packets include undersize, FCS/CRC, MTU exceeded, fragments, and oversize packets. All packets that list under this counter are discarded and not processed further. |
Excludes oversize packets without FCS/CRC. Packets larger than the MTU setting arriving on a network port are counted twice in the counter. So 1000 oversize packets would show up as 2000. This double-counting only happens with Oversize error packets. |
||||||||||||
|
Discards |
Discards Received or Transmitted |
Discards are counted in the following cases:
|
||||||||||||
|
Packet Drops |
Total Dropped Packets Received or Transmitted |
Packets are dropped when a port’s bandwidth is exceeded due to oversubscription. Packets are dropped when they reach the port but before they are sent out. |
||||||||||||
|
Octets |
Total Bytes Received or Transmitted Includes all valid and error frames with the exceptions noted in the adjacent columns. |
Excludes undersize frames. |
||||||||||||
|
Buffer Usage |
Percentage of buffer space used by packets transmitted or received |
The buffer is used when the port reaches 100 percent utilization during a microburst. If the buffer reaches 100 percent utilization, packets may be dropped. |
||||||||||||
|
Utilization |
Percentage of port utilization by packets received or transmitted |
|
||||||||||||
|
Packets |
Total Packets Received or Transmitted Excludes multicast packets, broadcast packets, packets with FCS/CRC errors, MTU exceeded errors, oversize packets, and pause packets. |
Excludes packets with FCS/CRC errors. |
Display Statistics for All Ports
To view the statistics for all ports select, Ports > Ports > Statistics. The Ports Statistics page displays, which shows a table with the statistics for each port as shown in 4. For the definitions of the statistics shown in the table, refer to Table 3: Port Statistics Definitions.
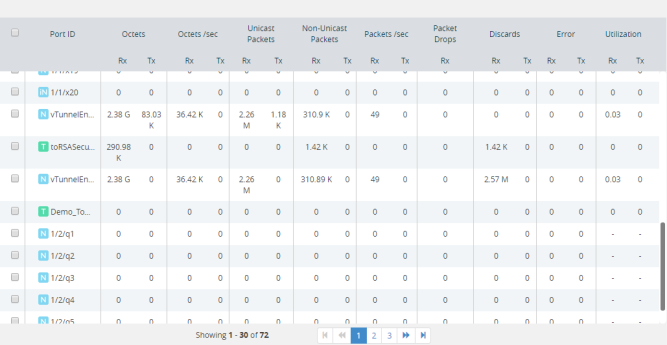
| 4 | Port Statistics for All Ports |
The information on the statistics page can be filtered as well as downloaded to an Excel spreadsheet. To export the statistics, click Export. The statics table is downloaded with a filename in the format Port_Stats_<yyyymmddhhmmss>; for example, Port_Stats_20161003172336.
To filter the port statistics, click Filter. A Filter Quick View opens, where you can specify how to filter ports displayed on the Statistics page.
The criteria that you can use to filter the port statistics is as follows:
|
Criteria |
Description |
|||||||||||||||||||||
|
Box/Slot ID |
Display only those ports that match the specified box and slot IDs. |
|||||||||||||||||||||
|
Port Alias |
Display port with the specified alias. |
|||||||||||||||||||||
|
Port ID |
Display ports with specified number in the port ID. For example, if you specify 3 the result will also display ports that include the number 3, 13, 23, 30, and so on. |
|||||||||||||||||||||
|
Type |
Display ports with the specified port type. Select one of the following:
|
|||||||||||||||||||||
|
Admin Status |
Display ports based on their current admin status. The possible selections are:
|
|||||||||||||||||||||
|
Link Status |
Display ports based on their current link status: The possible selections are:
|


